

Introduction: AI-based Aquatic Ultrasonic Imaging & Chemical Water Testing


Identify noxious air bubbles lurking in the substrate w/ ultrasonic scans and assess water pollution based on chemical tests simultaneously.
Supplies
1 x ELECROW Custom PCB
1 x UNIHIKER
1 x USB Webcam (PK-910H)
1 x Arduino Nano ESP32
1 x DFRobot URM15 - 75KHZ Ultrasonic Sensor
1 x DFRobot Gravity: RS485-to-UART Signal Adapter Module
1 x DFRobot Serial 6-Axis Accelerometer
1 x DS18B20 Waterproof Temperature Sensor
1 x SSD1306 OLED Display (128x64)
1 x LattePanda 3 Delta 864
1 x KITRONIK Edge Connector for BBC micro:bit
1 x 4.7K Resistor
4 x Button (6x6)
2 x 5 mm Common Anode RGB LED
1 x Anycubic Kobra 2 Max
1 x Power Jack
1 x External Battery
1 x USB Buck-Boost Converter Board
1 x Jumper Wires
Step 1: Story


Even though most of us consider water contamination as a gradual occurrence, especially for thriving landscapes, impending pollution can pervade water bodies instantaneously. In the case of enclosed water bodies such as closed lakes, pernicious contaminants can arise in a week and threaten aquatic environments despite not manifesting any indications. These furtively spreading pollutants can even impinge on the health of terrestrial animals by not only poisoning precious water sources but also withering aquatic plants.
In most cases, conducting only surface-level water quality tests is insufficient to pinpoint the hiding pollutants since contaminants can form in the underwater substrate by the accumulation of the incipient chemical agents. These underwater chemical reactions are commonly instigated by detritus, industrial effluents, and toxic sediment rife in the underwater substrate. After the culmination of the sinking debris, these reactions can engender algal blooms, hypoxia (dead zones), and expanding barren lands[1]. Since the mentioned occurrences are only the result of prolonged water pollution, they lead to the inexorable progress of complex toxic chemical interactions, even with plastic debris[2]. Therefore, the precedence must be given to identifying the underlying conditions of increasing underwater chemical reactions.
Especially in lower substrate levels, before reaching hazardous amounts, the combined chemical reactions between pollutants yield ample gas molecules enough to accumulate small-to-moderate air bubbles underwater. These lurking gas pockets affect aquatic plant root systems, deliver noxious contaminants to the surface level, and alter water quality unpredictably due to prevalent emerging contaminants. As a result of the surge of toxic air gaps, the affected water body can undergo sporadic aquatic life declines, starting with invertebrate and fry (or hatchling) deaths. Although not all instances of underwater air bubble activity can be singled out as an imminent toxic pollution risk, they can be utilized as a vital indicator to test water quality to preclude any potential environmental hazards.
In addition to protecting natural enclosed water bodies, detecting the accumulating underwater pollutants can also be beneficial and profitable for commercial aquatic animal breeding or plant harvesting, widely known as aquaculture. Since aquaculture requires the controlled cultivation of aquatic organisms in artificially enclosed water bodies (freshwater or brackish water), such as fish ponds and aquariums, the inflation of underwater air bubbles transferring noxious pollutants to the surface can engender sudden animal deaths, wilting aquatic plants, and devastating financial losses. Especially for fish farming or pisciculture involving more demanding species, the accumulating air bubbles in the underwater substrate can initiate a chain reaction resulting in the loss of all fish acclimatized to the enclosed water body. In severe cases, this can lead to algae-clad artificial environments threatening terrestrial animals and the incessant decline in survival rates.
After perusing recent research papers on identifying air bubbles in the underwater substrate, I noticed that there are no practical applications focusing on detecting underwater air bubbles and assessing water pollution consecutively so as to diagnose potential toxic contaminants before instigating detrimental effects on the natural environment or a commercial fish farm. Therefore, I decided to develop a feature-rich AIoT device to identify underwater air bubbles via a neural network model by applying ultrasonic imaging as a nondestructive inspection method and to assess water pollution consecutively based on multiple chemical water quality tests via an object detection model. In addition to AI-powered functions, I also decided to build capable user interfaces and a push notification service via Telegram.
Before working on data collection procedures and model training, I thoroughly searched for a natural or artificial environment demonstrating the ebb and flow of underwater substrate toxicity due to overpopulation and decaying detritus. Nevertheless, I could not find a suitable option near my hometown because of endangered aquatic life, unrelenting habitat destruction, and disposal of chemical waste mostly caused by human-led activities. Thus, I decided to set up an artificial aquatic environment simulating noxious air bubbles in the underwater substrate and potential water pollution risk. After conducting a meticulous analysis of fecund aquatic life with which I can replicate fish farm conditions in a medium-sized aquarium, I decided to set up a planted freshwater aquarium for harmonious and proliferating species — livebearers (guppies), Neocaridina shrimp, dwarf (or least) crayfish (Cambarellus Diminutus), etc. In the following steps, I shall explain all species in my controlled environment (aquarium) with detailed instructions.
Since the crux of identifying underwater air bubbles and assessing water pollution simultaneously requires developing an AI-driven device supporting multiple machine learning models, I decided to construct two different data sets — ultrasonic scan data (buffer) and chemical water quality test result (color-coded) images, build two different machine learning models — neural network and object detection, and run the trained models on separate development boards. In this regard, I was able to program distinct and feature-rich user interfaces for each development board, focusing on a different aspect of the complex AI-based detection process, and thus avoid memory allocation issues, latency, reduced model accuracy, and intricate data collection methods due to multi-sensor conflict.
Since Nano ESP32 is a brand-new and high-performance Arduino IoT development board providing a u-blox® NORA-W106 (ESP32-S3) module, 16 MB (128 Mbit) Flash, and an embedded antenna, I decided to utilize Nano ESP32 to collect ultrasonic scan (imaging) information and run my neural network model. Since I needed to utilize submersible equipment to generate precise aquatic ultrasonic scans, I decided to connect a DFRobot URM15 - 75KHZ ultrasonic sensor (via RS485-to-UART adapter module) and a DS18B20 waterproof temperature sensor to Nano ESP32. To produce accurate ultrasonic images from single data points and match the given image shape (20 x 20 — 400 points), I added a DFRobot 6-axis accelerometer. Finally, I connected an SSD1306 OLED display and four control buttons to program a feature-rich user interface.
I also employed Nano ESP32 to transfer the produced ultrasonic scan data and the selected air bubble class to a basic web application (developed in PHP) via an HTTP POST request. In this regard, I was able to save each ultrasonic scan buffer with its assigned air bubble class to a separate text (TXT) file and construct my data set effortlessly. I shall clarify the remaining web application features below.
After completing constructing my ultrasonic scan data set, I built my artificial neural network model (ANN) with Edge Impulse to identify noxious air bubbles lurking in the underwater substrate. Considering the unique structure of ultrasonic imaging data, I employed the built-in Ridge classifier as the model classifier, provided by Edge Impulse Enterprise. As a logistic regression method with L2 regularization, the Ridge classification combines conventional classification techniques and the Ridge regression for multi-class classification tasks. Since Edge Impulse is nearly compatible with all microcontrollers and development boards, even for complex Sklearn linear models, I have not encountered any issues while uploading and running my advanced model on Nano ESP32. As labels, I simply differentiate the ultrasonic scan samples depending on the underwater air bubble presence:
- normal
- bubble
After training and testing my neural network model with the Ridge classifier, I deployed the model as an Arduino library and uploaded it to Nano ESP32. Therefore, the device is capable of identifying underwater air bubbles by running the neural network model without any additional procedures or latency.
Since UNIHIKER is an exceptionally compact single-board computer providing a built-in touchscreen, integrated Python modules, and micro:bit-compatible edge connector support, I decided to utilize UNIHIKER to collect chemical water quality test result (color-coded) images and run my object detection model. To capture image samples of multiple water quality tests, I connected a high-quality USB webcam to UNIHIKER. Then, I programmed a feature-rich user interface (GUI) and displayed the interactive interface on the built-in touchscreen by employing the integrated Python modules on Thonny.
After completing constructing my image data set, I built my object detection model with Edge Impulse to assess water pollution levels based on the applied chemical water quality tests. Since detecting water pollution levels based on color-coded chemical water quality tests is a complicated task, I decided to employ a highly advanced machine learning algorithm from the NVIDIA TAO Toolkit fully supported by Edge Impulse Enterprise — RetinaNet (which is an exceptional algorithm for detecting smaller objects). Since Edge Impulse Enterprise provides configurable backbones for RetinaNet and is compatible with nearly every development board, I have not encountered any issues while uploading and running my NVIDIA TAO RetinaNet object detection model on UNIHIKER. As labels, I utilized empirically assigned pollution levels while observing chemical water tests:
- sterile
- dangerous
- polluted
After training and testing my RetinaNet object detection model, I deployed the model as a Linux (AARCH64) application (.eim) and uploaded it to UNIHIKER. Thus, the device is capable of assessing water pollution levels based on the applied chemical water quality tests by running the object detection model independently without any additional procedures, reduced accuracy, or latency.
Even though this underwater air bubble and water pollution detection device is composed of two separate development boards, I focused on building full-fledged AIoT features with seamless integration and enabling the user to access the interconnected device features within feature-rich and easy-to-use interfaces. Therefore, I decided to develop a versatile web application from scratch in order to obtain the generated ultrasonic scan buffer (20 x 20 — 400 data points) with the selected air bubble class via an HTTP POST request from Nano ESP32 and save the received information as text (TXT) file. Furthermore, similar to the ultrasonic scan samples, the web application can save model detection results — buffer passed to the neural network model and the detected label — as text files in a separate folder.
Then, I employed the web application to communicate with UNIHIKER to generate a pre-formatted CSV file from the stored sample text files (ultrasonic scan data records) and transfer the latest neural network model detection result (ultrasonic scan buffer and the detected label) via an HTTP GET request.
As mentioned repeatedly, each generated ultrasonic scan buffer provides 400 data points as a 20 x 20 ultrasonic image despite the fact that Nano ESP32 cannot utilize the given buffer to produce an ultrasonic image after running the neural network model with the Ridge classifier. Therefore, after receiving the latest model detection result via the web application, I employed UNIKIHER to modify a template image (black square) via the built-in OpenCV functions to convert the given ultrasonic scan buffer to a JPG file and save the modified image to visualize the latest aquatic ultrasonic scan with thoroughly encoded pixels.
Since the RetinaNet object detection model provides accurate bounding box measurements, I also utilized UNIHIKER to modify the resulting images to draw the associated bounding boxes and save the modified resulting images as JPG files for further inspection.
After conducting experiments with both models and producing significant results, I decided to set up a basic Telegram bot to inform the user of the latest model detection results by transferring the latest generated ultrasonic image with the detected air bubble class and the latest modified resulting image of the object detection model. Since Telegram is a cross-platform cloud-based messaging service with a fully supported HTTP-based Bot API, Telegram bots can receive images from the local storage directly without requiring a hosting service. Thus, I was able to transfer the modified images (of both models) from UNIHIKER to the Telegram bot without establishing an SSL connection.
Considering the tricky operating conditions near an aquaculture facility and providing a single-unit device structure, I decided to design a unique PCB after testing all connections of the prototype via breadboards. Since I wanted my PCB design to represent the enchanting and mystique underwater aquatic life, I decided to design a Squid-inspired PCB. Thanks to the micro:bit-compatible edge connector, I was able to attach all components and development boards to the PCB smoothly.
Finally, to make the device as robust and compact as possible, I designed a complementing Aquatic-themed case (3D printable) with a modular holder encasing the PCB outline, a hang-on aquarium connector mountable to the PCB holder, a hang-on camera holder to place the high-quality USB webcam when standing idle, and a removable top cover allowing the user to attach sensors to the assigned slots. The semicircular-shaped mounting brackets are specifically designed to contain the waterproof temperature sensor.
So, this is my project in a nutshell 😃
In the following steps, you can find more detailed information on coding, collecting ultrasonic scan information, capturing chemical water quality test result images, building neural network and object detection models with Edge Impulse Enterprise, running the trained models on Nano ESP32 and UNIHIKER, developing a versatile web application, and setting up a Telegram bot to inform the user via push notifications.
🎁🎨 Huge thanks to ELECROW for sponsoring this project with their high-quality PCB manufacturing service.
🎁🎨 Huge thanks to DFRobot for sponsoring these products:
⭐ UNIHIKER | Inspect
⭐ URM15 - 75KHZ Ultrasonic Sensor | Inspect
⭐ Gravity: RS485-to-UART Signal Adapter Module | Inspect
⭐ Serial 6-Axis Accelerometer | Inspect
⭐ LattePanda 3 Delta 864 | Inspect
🎁🎨 Also, huge thanks to Anycubic for sponsoring a brand-new Anycubic Kobra 2 Max.
Step 2: Designing and Soldering the Squid-inspired PCB


Before prototyping my Squid-inspired PCB design, I inspected the detailed pin reference of Nano ESP32, the micro:bit connector-based UNIHIKER pinout, and the supported transmission protocols of the measurement sensors. Then, I checked the wireless (Wi-Fi) communication quality between Nano ESP32, UNIHIKER, and the web application while transferring and receiving data packets.
Then, I designed my Squid-inspired PCB by utilizing Autodesk Fusion 360 and KiCad. Since I wanted to design a distinctive 3D-printed hang-on holder to simplify the PCB placement on the simulated fish farm (aquarium), I created the PCB outline on Fusion 360 and then imported the outline file (DXF) to KiCad. As mentioned earlier, I decided to utilize squid as the fulcrum of my PCB design since I wanted my device to resemble the enchanting underwater atmosphere.
To replicate this air bubble and water pollution detection device, you can download the Gerber file below and order my PCB design from ELECROW directly.
Normally, it would not be possible to embed most of the commercial single-board computers directly into a PCB without applying arduous disassembly methods. Nevertheless, UNIHIKER provides a micro:bit-compatible connector to access the GPIO interface of the microcontroller coprocessor (RISC-V). Therefore, I was able to embed UNIHIKER as the centerpiece of my PCB by utilizing a micro:bit-compatible edge connector from Kitronik.
If you want to add the Kitronik edge connector to your PCB designs, you can inspect its KiCad component library and footprint.
By utilizing a TS100 soldering iron, I attached headers (female), a DS18B20 waterproof temperature sensor, a Kitronik micro:bit-compatible edge connector, pushbuttons (6x6), 5 mm common anode RGB LEDs, a 4.7K resistor, and a power jack to the Squid PCB.
📌 Component list on the PCB:
A1 (Headers for Arduino Nano ESP32)
UNIHIKER1 (Kitronik micro:bit-compatible Edge Connector)
DS18B20 (DS18B20 Waterproof Temperature Sensor)
URM15 (Headers for RS485-to-UART Signal Adapter Module)
ACC1 (Headers for Serial 6-Axis Accelerometer)
S1 (Headers for SSD1306 OLED Display)
R1 (4.7K Resistor)
K1, K2, K3, K4 (6x6 Pushbutton)
D1, D2 (5 mm Common Anode RGB LED)
J2 (Headers for Available UNIHIKER Pins)
J1 (Power Jack)
Step 3: Making Connections and Adjustments


// Connections
// Arduino Nano ESP32 :
//                                URM15 - 75KHZ Ultrasonic Sensor via RS485-to-UART Signal Adapter Module
// D3      ------------------------ TX
// D2      ------------------------ RX
// 3.3V    ------------------------ +
// GND     ------------------------ -
//                                Serial 6-Axis Accelerometer
// 3.3V    ------------------------ VCC
// D5      ------------------------ RXD
// D4      ------------------------ TXD
// GND     ------------------------ GND
//                                DS18B20 Waterproof Temperature Sensor
// A1      ------------------------ Data
//                                SSD1306 OLED Display (128x64)
// A4      ------------------------ SDA
// A5      ------------------------ SCL
//                                Control Button (A)
// D6      ------------------------ +
//                                Control Button (B)
// D7      ------------------------ +
//                                Control Button (C)
// D8      ------------------------ +
//                                Control Button (D)
// D9      ------------------------ +
//                                5mm Common Anode RGB LED
// D10     ------------------------ R
// D11     ------------------------ G
// D12     ------------------------ B
&
&
&
// Connections
// UNIHIKER :
//                                5mm Common Anode RGB LED
// P4      ------------------------ R
// P5      ------------------------ G
// P6      ------------------------ B
#️⃣ Although the URM15 is an exceptional ultrasonic ranging sensor providing an IP65 waterproof probe with a measuring range of 30 cm - 500 cm, it does not support direct data transmission and requires the standard Modbus-RTU protocol for stable communication. Thus, I utilized an RS485-to-UART signal adapter module (active-isolated) to obtain the generated ultrasonic distance measurements from the ultrasonic sensor and transfer them to Nano ESP32 via serial communication. Since Nano ESP32 cannot supply the stable 12V required for the URM15 ultrasonic sensor, I connected a USB buck-boost converter board to an external battery to obtain the demanding 12V to power the ultrasonic sensor through the signal adapter module.
#️⃣ Since the URM15 ultrasonic sensor supports the external temperature compensation to obviate the undulating ambient temperature effect, I utilized a DS18B20 waterproof temperature sensor to tune the ultrasonic sensor. As shown in the schematic below, before connecting the DS18B20 waterproof temperature sensor to Nano ESP32, I attached a 4.7K resistor as a pull-up from the DATA line to the VCC line of the sensor to generate accurate temperature measurements.
#️⃣ To detect the movement of the ultrasonic sensor probe underwater while collecting data, I utilized a 6-axis accelerometer supporting UART communication. Since I employed Nano ESP32 to pass the collected data buffers directly to the web application, I did not need to connect an external storage module such as a microSD card module.
#️⃣ To provide the user with a feature-rich interface, I connected an SSD1306 OLED display and four control buttons to Nano ESP32. I also added an RGB LED to inform the user of the device status while performing operations related to Nano ESP32.
#️⃣ Since UNIHIKER (RK3308 Arm 64-bit) is an outstandingly compact single-board computer providing a USB Type-A connector for peripherals, I was able to connect a high-quality USB webcam (PK-910H) to capture and save image samples effortlessly.
#️⃣ As explained earlier, UNIHIKER comes with a micro:bit-compatible connector to access the GPIO interface of the microcontroller coprocessor (RISC-V). I utilized the Kitronik edge connector to access the GPIO pins and adjust the secondary RGB LED to inform the user of the device status while performing operations related to UNIHIKER. In this regard, I was able to embed UNIHIKER into the Squid PCB as the centerpiece to build a single-unit device.
#️⃣ Before embedding UNIHIKER, I tested the micro:bit-compatible GPIO interface by utilizing a soldered Kitronik breakout board with the edge connector.
#️⃣ After completing soldering and adjustments, I attached all remaining components to the Squid PCB via the female headers.
Step 4: Designing and Printing the Aquatic-themed Case


Since I focused on building a feature-rich and accessible AI-powered device that identifies noxious underwater air bubbles via aquatic ultrasonic scans and evaluates water pollution based on chemical water quality tests via object detection so as to inform the user via Telegram push notifications, I decided to design a robust and modular case allowing the user to hang the Squid PCB on the aquarium, place the high-quality USB webcam when standing idle, and position the ultrasonic sensor effortlessly while scanning underwater substrate. To avoid overexposure to water and prevent open wire connections from short circuits, I added a removable top cover mountable to the main case via snap-fit joints. The semicircular-shaped mounting brackets on the top cover let the user attach the DS18B20 waterproof temperature sensor effortlessly. Then, I designed a unique PCB holder encasing the Squid PCB outline and a hang-on aquarium connector mountable to the PCB holder via M3 screws and nuts. To place the high-quality USB webcam when standing idle, I also designed a hang-on camera holder attachable to the side of the aquarium. Furthermore, I decided to emboss aquatic life with sound-based graphic icons on the removable top cover and the camera symbol on the camera holder to highlight the qualifications of this AI-powered underwater air bubble detection device.
Since I needed to position the URM15 ultrasonic sensor accurately while scanning the underwater substrate and generating data buffers, I added a special cylindrical slot to the end point of the L-shaped main case in order to fasten the ultrasonic sensor seamlessly.
I designed the L-shaped main case, the removable top cover, the Squid PCB holder, the hang-on aquarium connector of the PCB holder, and the hang-on camera holder in Autodesk Fusion 360. You can download their STL files below.
Then, I sliced all 3D models (STL files) in Ultimaker Cura.
Since I wanted to create a mystique watery structure for the device case and apply a unique underwater theme representing the mesmerizing aquatic life, I utilized these PLA filaments:
- ePLA-Silk Magic Green-Blue (main case and top cover)
- ePLA-Matte Light Blue (PCB holder and hang-on connectors)
Finally, I printed all parts (models) with my brand-new Anycubic Kobra 2 Max 3D Printer.
Since Anycubic Kobra 2 Max is budget-friendly and specifically designed for high-speed printing with a gigantic build volume, I highly recommend Anycubic Kobra 2 Max if you are a maker or hobbyist needing to print large prints without compartmentalizing your design and losing structural integrity while working on multiple prototypes before finalizing a complex project.
Thanks to its upgraded direct extruder and vibration compensation features, Anycubic Kobra 2 Max provides 300 mm/s recommended print speed (up to 500 mm/s) and enhanced layer quality. Also, it provides a high-speed optimized cooling system, reducing visible layer lines and complementing the fast printing experience. Since the Z-axis has dual-motors and dual-support rods, it prevents vibration from affecting layer smoothness and integrity, even at higher print speeds.
Furthermore, Anycubic Kobra 2 Max provides a magnetic suction platform on the heated bed for the scratch-resistant PEI spring steel build plate, allowing the user to remove prints without any struggle, even for larger prints up to 420x420x500 mm. Most importantly, you can level the bed automatically via its user-friendly LeviQ 2.0 automatic leveling system and custom Z-axis compensation. Also, it has a smart filament runout sensor and supports Anycubic APP for remote control and management.
#️⃣ First of all, remove all fixing plates. Then, install the gantry frame and support rods.
#️⃣ Install the print head and adjust the X-axis belt tensioner. Then, install the touchscreen and the filament runout sensor.
#️⃣ Connect the stepper, switch, screen, and print head cables. Then, attach the filament tube and use cable ties to secure the cables properly.
#️⃣ If the print head or bed is shaking, adjust the hexagonal isolation columns underneath them.
#️⃣ To avoid software-related print failures, update the device firmware manually via USB or directly over Wi-Fi.
I encountered some errors due to Cura configurations before the official 2.3.6 firmware.
#️⃣ After the firmware upgrade, go to Settings ➡ More Settings ➡ Guide so as to initiate the LeviQ 2.0 automatic bed leveling system and configure vibration calibration.
#️⃣ Finally, fix the filament tube with the cable clips, install the filament holder, and insert the filament into the extruder.
#️⃣ Since Anycubic Kobra 2 Max is not officially supported by Cura yet, we need to set it manually. Fortunately, Anycubic provides detailed configuration steps for Anycubic Kobra 2 Max on Cura.
#️⃣ First of all, create a custom printer profile on Cura for Anycubic Kobra 2 Max with given printer settings.
#️⃣ Then, import the printer profile (configuration) file provided by Anycubic, depending on the filament type.
Step 5: Assembling the 3D-printed Case


After printing all parts (models), I attached the URM15 ultrasonic sensor into its special cylindrical slot on the end point of the L-shaped main case and fastened the remaining components to their corresponding slots within the main case via a hot glue gun.
Then, I fastened the Squid PCB to its unique PCB holder via the hot glue gun, encasing the PCB outline. After fastening the Squid PCB, I attached the hang-on aquarium connector to the back of the PCB holder via M3 screws and nuts.
Since the removable top cover has special semicircular-shaped mounting brackets, the DS18B20 waterproof temperature sensor can externally be attached to the top cover.
Finally, I affixed the top cover to the main case via its provided snap-fit joints.
Since the main case contains all cables required for the connections between the Squid PCB and sensors, the device provides a single-unit structure and operates without wiring redundancy.
Step 6: Setting Up an Aquarium With Prolific Breeders to Simulate Harsh Fish Farm Conditions


As explained earlier, before working on data collection procedures, I needed to find a natural or artificial environment demonstrating the ebb and flow of underwater substrate toxicity and water quality fluctuations due to overpopulation and decaying detritus. Unfortunately, I could not find a suitable natural environment near my hometown due to endangered aquatic life, unrelenting habitat destruction, and disposal of chemical waste mostly caused by human-led activities. Since I did not have access to an aquaculture facility to observe underwater substrate toxicity because of commercial aquatic animal breeding or plant harvesting, I decided to set up an artificial aquatic environment simulating noxious air bubbles in the underwater substrate and potential water pollution risk. Instead of setting up a small artificial garden pond for the commercial breeding of profitable fish (mostly for food), I decided to utilize a medium-sized aquarium (10 gallons) to replicate fish farm (or pisciculture) conditions.
Since this aquarium setting let me inspect the abrupt changes in the lower underwater substrate, I was able to conduct precise experiments to collect aquatic ultrasonic scan data for air bubble identification with ultrasonic imaging and capture chemical water quality test result (color-coded) images for water pollution detection.
After conducting a painstaking analysis of prolific aquatic life with which I can observe commercial fish farm conditions affecting the lower underwater substrate with noxious air bubbles and exacerbating the decreasing water quality due to decaying detritus, I decided to set up a planted freshwater aquarium for harmonious and proliferating species that can thrive in a small freshwater aquarium — livebearers (guppies), Neocaridina shrimp, dwarf (or least) crayfish (Cambarellus Diminutus), etc.
To set up a self-sustaining aquarium manifesting harsh fish farm conditions, I added these aquatic species:
- 🐠 Mosaic Dumbo Ear Guppies
- 🐠 Snow White Guppies
- 🐠 Half Black Guppies
- 🐠 Green Snakeskin Cobra Guppies
- 🐠 Red Rose Guppies
- 🦐 Red Sakura Neocaridina Shrimps
- 🦐 Black Rose Neocaridina Shrimps
- 🦐 Vietnam Leopard Neocaridina Shrimps
- 🦐 Blue Angel Neocaridina Shrimps
- 🦐 Sakura Orange Neocaridina Shrimps
- 🦐 Red Rili Neocaridina Shrimps
- 🦐 Carbon Rili Neocaridina Shrimps
- 🦐 Green Jelly Neocaridina Shrimps
- 🦐 Yellow Fire Neon Neocaridina Shrimps
- 🦞 Cambarellus Diminutus — Dwarf (or least) Crayfish
- 🐌 Yellow Mystery (Apple) Snails
- 🐌 Blue Mystery (Apple) Snails
- 🐌 Black Poso Rabbit Snails
- 🐌 Bumblebee Horn (Nerite) Snails
- 🐌 Ramshorn Snails (removed due to overpopulation)
After deciding on the fecund aquatic species for my aquarium, I allowed them to spawn and breed for nearly five months and observed the changes in the aquarium due to overbreeding and decaying detritus.
After my submerged aquatic plants, floating plants (frogbit and duckweed), and emersed (root-submerged) pothos flourished, they filtered free ammonia, nitrates, and phosphates, diminished excess algae, and provided oxygen. Therefore, I was able to eliminate the accumulating contaminants caused by the regular feeding schedule in a small aquarium and focus on detecting the underwater air bubbles and assessing water pollution due to prolonged overbreeding and decaying detritus.
⚠️ Disclaimer: To simulate the abrupt water quality fluctuations of a commercial fish farm, I let my aquarium go overstock with guppy fry and shrimplets, which led to the accumulation of excess waste, occasional Ramshorn snail blooms, and sporadic algae blooms. Thus, to maintain the ideal experiment conditions for identifying noxious air bubbles lurking in the underwater substrate, I needed to do regular water changes, sometimes every four days. After completing my experiments, I safely transferred abundant guppies and shrimps to my local fish store.
Step 7: Observing the Changing Conditions Due to Overbreeding and Decaying Detritus


After concluding the device assembly, I hung the Squid PCB holder and the camera holder on the front side of the aquarium while collecting ultrasonic scan data buffers and capturing chemical water quality test result images. In this regard, I was able to place the high-quality USB webcam on the hang-on camera holder when standing idle and position the URM15 ultrasonic sensor precisely while scanning the underwater substrate to produce accurate ultrasonic images.
Since I designed a single-unit device structure, I did not encounter any issues while conducting extended experiments.
To increase the bottom surface area and observe abundant noxious air bubbles while collecting ultrasonic scan data, I added umpteen marimo moss balls covering the bottom of the tank. In this regard, I was able to provide plentiful underwater substrate gaps for incipient air bubbles to accumulate.
Step 8: Building a Telegram Bot With BotFather to Send Push Notifications


BotFather is an official Telegram bot that lets the user build and manage bots within the Telegram app without any coding or subscription required. I utilized BotFather to create a simple Telegram bot to inform the user via push notifications.
#️⃣ First of all, open BotFather on Telegram and enter /start to view the available command list and instructions.
#️⃣ Enter the /newbot command to create a new bot. Register the Telegram bot name when BotFather requests a name. It will be displayed in contact details and elsewhere.
Aquatic Ultrasonic Imaging and Water Testing
#️⃣ Then, register the bot username — tag. Usernames are 5-32 characters long and case insensitive but may only include Latin characters, numbers, and underscores. They must end in 'bot', e.g. 'tetris_bot' or 'TetrisBot'.
aquatic_ultrasonic_bot
#️⃣ After completing the steps above, BotFather generates an authorization token for the new Telegram bot. The authorization token is a string, such as 123456:ABC-DEF1234ghIkl-zyx57W2v1u123ew11, that is required to authorize the bot and send requests to the HTTP-based Telegram Bot API. Keep the generated token secure and store it safely.
#️⃣ To change the profile picture of the Telegram bot, enter the /setuserpic command and upload a picture.
#️⃣ Finally, to add a description to the Telegram bot to be displayed whenever the user initiates a new chat, enter the /setdescription command and register the text description.
Since I wanted to send push notifications via the HTTP-based Telegram Bot API from UNIHIKER but not retrieve information back, I did not need to establish an SSL connection to set a webhook for the Telegram Bot API.
Thanks to the official Telegram Bot API, I only needed to obtain the chat id parameter to be able to send push notifications with the secured Telegram bot authorization token.
To fetch the required chat id, I utilized the getUpdates method (HTTP GET request), which shows all incoming bot updates by using long polling and returns an array of Update objects.
#️⃣ Make an HTTP GET request by utilizing the secured Telegram bot authorization token:
https://api.telegram.org/bot<_token_>/getUpdates
#️⃣ Then, initiate a new chat and send a message to the given Telegram bot. After refreshing the page, it should display the Update object list, including the chat id:
- message ➡ chat ➡ id ➡ 6465514194
Step 9: Developing a Web Application to Communicate W/ UNIHIKER and Process Requests From Nano ESP32


Since I needed to obtain the ultrasonic scan data buffers and the given air bubble class from Nano ESP32 so as to save the data records as text (TXT) files, I decided to develop a basic web application.
Also, the web application can generate a pre-formatted CSV file from the stored data records (text files) when requested via an HTTP GET request to construct a data set effortlessly.
In addition to the data collection features, similar to the ultrasonic scan samples, the web application can save model detection results transferred by Nano ESP32 via an HTTP POST request — buffer passed to the neural network model and the detected air bubble label — as text files in a separate folder.
As shown below, the web application consists of two folders and two code files:
- /detection
- /sample
- generate.php
- index.php
- scan_data_items.csv
📁 index.php
⭐ Obtain the current date and time.
⭐ Initiate the text file name for the received ultrasonic scan data buffer by adding the collection or prediction date.
$date = date("Y_m_d_H_i_s");

# Define the text file name of the received ultrasonic scan data.
$txt_file = "%s_%s__".$date;
$save_folder = " ";
⭐ If Nano ESP32 transfers the data type and the selected or detected air bubble class for the received ultrasonic scan buffer via GET query parameters, modify the text file name accordingly. Then, select the folder to save the generated text file — sample or detection.
if(isset($_GET["scan"]) && isset($_GET["type"]) && isset($_GET["class"])){
	$txt_file = sprintf($txt_file, $_GET["type"], $_GET["class"]);
	$save_folder = $_GET["type"];
}
⭐ If Nano ESP32 transfers an ultrasonic scan data buffer via an HTTP POST request as a new sample or after running the neural network model, save the received buffer with the selected or detected air bubble class to the folder associated with the given data type as a TXT file — sample or detection.
if(!empty($_FILES["ultrasonic_scan"]['name'])){
	// Text File:
	$received_scan_properties = array(
	    "name" => $_FILES["ultrasonic_scan"]["name"],
	    "tmp_name" => $_FILES["ultrasonic_scan"]["tmp_name"],
		"size" => $_FILES["ultrasonic_scan"]["size"],
		"extension" => pathinfo($_FILES["ultrasonic_scan"]["name"], PATHINFO_EXTENSION)
	);

    // Check whether the uploaded file's extension is in the allowed file formats.
	$allowed_formats = array('jpg', 'png', 'bmp', 'txt');
	if(!in_array($received_scan_properties["extension"], $allowed_formats)){
		echo 'FILE => File Format Not Allowed!';
	}else{
		// Check whether the uploaded file size exceeds the 5 MB data limit.
		if($received_scan_properties["size"] > 5000000){
			echo "FILE => File size cannot exceed 5MB!";
		}else{
			// Save the uploaded file (TXT).
			move_uploaded_file($received_scan_properties["tmp_name"], "./".$save_folder."/".$txt_file.".".$received_scan_properties["extension"]);
			echo "FILE => Saved Successfully!";
		}
	}
}
📁 generate.php
⭐ In the read_scans function:
⭐ Get all text file paths under the sample folder via the built-in glob function.
⭐ Read each text file to obtain the saved ultrasonic scan data buffers.
⭐ Derive the selected air bubble class of the data record from the given text file name.
⭐ Then, remove the redundant comma from the end of the data record.
⭐ After decoding 400 comma-separated data points from the given data record, append the retrieved data items with the selected class as a child array to the information array (parent) by utilizing built-in array_merge and array_push functions.
⭐ Finally, return the modified parent array consisting of the fetched data items.
function read_scans(){
	$information = [];
	// Get all text file paths under the sample folder.
	$files = glob("./sample/*.txt");
	// Read each text file to obtain the ultrasonic scan information — data items.
	foreach($files as $scan){
		$line = [];
		// Derive the provided air bubble label from the given text file name.
		$label = explode("_", $scan)[1];
		array_push($line, $label);
		// Read the ultrasonic scan information.
		$record = fopen($scan, "r");
		$data_items = fread($record, filesize($scan));
		// Remove the redundant comma from the data record (scan).
		$data_items = substr($data_items, 0, -1);
		// Append the retrieved data items.
		$data_items = explode(",", $data_items);
		$line = array_merge($line, $data_items);
        array_push($information, $line);
        // Close the text file.
		fclose($record);
	}
	// Return the fetched data items.
	return $information;
}
⭐ In the create_CSV function:
⭐ Obtain the generated parent array, including data items and the assigned class for each stored ultrasonic scan data record — sample.
⭐ Create a new CSV file — scan_data_items.csv.
⭐ Define and add the header (class and data fields) to the created CSV file.
⭐ Append each child array (element) of the parent array as a new row to the CSV file.
⭐ Finally, close the generated CSV file.
function create_CSV(){
	// Obtain the generated data items array from ultrasonic scans — data records.
	$information = read_scans();
	// Create the scan_data_items.csv file.
	$filename = "scan_data_items.csv";
	$fp = fopen($filename, 'w');
	// Create and add the header to the CSV file.
	$header = [];
	array_push($header, "air_bubble_label");
	for($i=0;$i<400;$i++){ array_push($header, "p_".strval($i)); }
	fputcsv($fp, $header);
	// Append the retrieved data items as rows for each ultrasonic scan to the CSV file.
	foreach($information as $row){
		fputcsv($fp, $row);
	}
	// Close the CSV file.
	fclose($fp);
}
⭐ In the get_latest_detection function:
⭐ Via the built-in scandir function, obtain the latest model detection result saved as a text file under the detection folder — ultrasonic scan buffer passed to the neural network model.
⭐ Derive the detected air bubble label from the given file name.
⭐ Remove the redundant comma from the end of the given buffer.
⭐ Add the detected label to the revised buffer.
⭐ Then, pass the generated data packet as a string.
function get_latest_detection($folder){
	$scan = scandir($folder, 1);
	// Label (model result).
	$model_result = explode("_", $scan[0])[1];
	// Data record.
	$file = $folder.$scan[0];
	$record = fopen($file, "r");
	$data_items = fread($record, filesize($file));
	// Remove the redundant comma from the data record (scan).
	$data_items = substr($data_items, 0, -1);
	// Append the model result to the data record.
	$data_packet = $model_result."_".$data_items;
	// Pass the generated data packet.
	echo $data_packet;
    // Close the text file.
    fclose($record);
}
⭐ If requested by the user via an HTTP GET request, create a pre-formatted CSV file from the stored aquatic ultrasonic scan samples (text files) — data records.
if(isset($_GET["create"]) && $_GET["create"] == "csv"){
	create_CSV();
	echo "Server => CSV file created successfully!";
}
⭐ If requested by the user via an HTTP GET request, obtain the latest model detection result — ultrasonic scan buffer passed to the neural network model and the detected air bubble class — and return the generated data packet as a string.
if(isset($_GET["model_result"]) && $_GET["model_result"] == "OK"){
	get_latest_detection("./detection/");
}
Step 10: Setting and Running the Web Application on LattePanda 3 Delta

Since I wanted to build a feasible and accessible AIoT underwater air bubble and water pollution detection device not dependent on cloud or hosting services, I decided to host my web application on LattePanda 3 Delta 864. Therefore, I needed to set up a LAMP web server.
LattePanda 3 Delta is a pocket-sized hackable computer that provides ultra performance with the Intel 11th-generation Celeron N5105 processor.
Plausibly, LattePanda 3 Delta can run the XAMPP application. So, it is effortless to create a server with a MariaDB database on LattePanda 3 Delta.
#️⃣ Install and set up the XAMPP development environment.
Step 11: Setting Up Nano ESP32 on Arduino IDE


Since Nano ESP32 has the well-known Nano form and provides Wi-Fi connectivity via the u-blox® NORA-W106 (ESP32-S3) module, I decided to employ Nano ESP32 to transfer data packets directly to the web application, including the produced aquatic ultrasonic scan buffer, the selected air bubble class for samples, and the detected air bubble label after running the neural network model.
Nevertheless, before proceeding with the following steps, I needed to set Nano ESP32 on the Arduino IDE, install the required libraries, and configure some default settings.
#️⃣ To install the required core, navigate to Tools ➡ Board ➡ Boards Manager and search for Arduino ESP32 Boards.
#️⃣ After installing the core, navigate to Tools ➡ Board ➡ ESP32 Arduino (Arduino) and select Arduino Nano ESP32.
#️⃣ Download and inspect the required libraries for the URM15 - 75KHZ ultrasonic sensor, the 6-axis accelerometer, the DS18B20 waterproof temperature sensor, and the SSD1306 OLED display:
DFRobot_RTU | Download
DFRobot_WT61PC | Download
OneWire | Download
DallasTemperature | Download
Adafruit_SSD1306 | Download
Adafruit-GFX-Library | Download
Step 12: Displaying Images on the SSD1306 OLED Screen


#️⃣ To be able to display images (icons) on the SSD1306 OLED screen, first convert image files (PNG or JPG) to monochromatic bitmaps. Then, convert the generated bitmaps to compatible C data arrays. I decided to utilize LCD Assistant to create C data arrays.
#️⃣ After installing LCD Assistant, upload a monochromatic bitmap and select Vertical or Horizontal, depending on the screen type.
#️⃣ Then, save all the converted C data arrays to the logo.h file.
⭐ In the logo.h file, I defined multi-dimensional arrays to group the assigned logos (interface and class) and their sizes — width and height.
// Define the assigned interface logo information as arrays.
PROGMEM static const unsigned char *interface_logos[] = {home_bits, data_bits, sensor_bits, save_bits, run_bits};
int interface_widths[] = {home_width, data_width, sensor_width, save_width, run_width};
int interface_heights[] = {home_height, data_height, sensor_height, save_height, run_height};

// Define the assigned air bubble class icon information as arrays.
PROGMEM static const unsigned char *class_logos[] = {bubble_bits, normal_bits};
int class_widths[] = {bubble_width, normal_width};
int class_heights[] = {bubble_height, normal_height};

...

display.drawBitmap(SCREEN_WIDTH-l_w, SCREEN_HEIGHT-l_h, interface_logos[menu_option], l_w, l_h, SSD1306_WHITE);
Step 13: Setting Up UNIHIKER on MobaXterm & Thonny


Although UNIHIKER is an outstandingly compact single-board computer providing a built-in touchscreen, integrated Python modules, and a microcontroller coprocessor, I still needed to install the required Python modules and set up the necessary software before proceeding with the following steps.
#️⃣ First of all, if you are a novice in programming with UNIHIKER, please visit the official tutorials and guidelines.
#️⃣ After connecting UNIHIKER to the computer via a USB Type-C cable, go to the home page of UNIHIKER's local web server via the default browser: 10.1.2.3.
#️⃣ Then, navigate to Network Settings and establish the Wi-Fi connection.
#️⃣ Since it is necessary to utilize the terminal to install Python modules, but UNIHIKER does not allow the user to access the terminal via its onboard interface, I needed to connect to UNIHIKER remotely via SSH.
#️⃣ To set up the SSH connection to access the terminal, I decided to utilize MobaXterm due to its advanced terminal configuration options.
#️⃣ After installing MobaXterm, connect to the UNIHIKER remote host with the default root user credentials:
- Server (Host): 10.1.2.3
- Account (Username): root
- Password: dfrobot
#️⃣ After establishing the SSH connection via MobaXterm, to run Edge Impulse object detection models on UNIHIKER, install the Edge Impulse Linux Python SDK by utilizing the terminal.
sudo apt-get install libatlas-base-dev libportaudio2 libportaudiocpp0 portaudio19-dev python3-pip
#️⃣ To be able to utilize the Linux Python SDK, the Cython module is required on UNIHIKER. However, the latest Cython version is not compatible with the SDK. According to my experiments, the Cython 0.29.36 version works without a problem.
pip3 install cython==0.29.36
#️⃣ After downloading the correct Cython version, continue installing the Linux Python SDK.
pip3 install pyaudio edge_impulse_linux
#️⃣ Since I employed the integrated Python modules to control the GPIO pins of the microcontroller coprocessor, design a feature-rich user interface (GUI — Tkinter application), and display the interactive user interface on the built-in touchscreen, I did not need to install any additional Python libraries via MobaXterm.
#️⃣ Although MobaXterm lets the user access the root folder and run Python scripts, I decided to utilize Thonny Python IDE to program my Python scripts due to its simple debugger.
#️⃣ After installing the required modules via MobaXterm, open Thonny and connect UNIHIKER by applying the built-in Remote Python 3 (SSH) interpreter.
#️⃣ After changing the interpreter, use the default root user credentials to initiate the SSH connection on Thonny.
#️⃣ After establishing the SSH connection, Thonny lets the user access the root folder, create directories, upload files (assets), and run Python scripts.
#️⃣ Although Thonny does not let the user install or update Python modules, to inspect the available (pre-installed) libraries, go to Tools ➡ Manage packages...
#️⃣ To run code files manually without establishing the SSH connection, press the onboard Home button on UNIHIKER, go to Run Programs, and select a code file.
Step 14: Collecting Information Produced by the Ultrasonic Sensor and the Accelerometer


After setting Nano ESP32 on the Arduino IDE, I programmed Nano ESP32 to initiate an aquatic ultrasonic scan, generate an ultrasonic scan data buffer according to the movements detected by the accelerometer, and transfer the generated ultrasonic scan buffer to the web application via an HTTP POST request.
Since I wanted to provide a feature-rich user interface allowing the user to assign labels while collecting data samples, I decided to connect the SSD1306 OLED display and four control buttons to Nano ESP32. Via the user interface, I was able to assign air bubble classes empirically and send the generated ultrasonic scan buffer with the selected air bubble class (label) directly to the web application. As mentioned earlier, Nano ESP32 does not provide an onboard storage option. Thus, by transferring samples to the web application, I obviated the need for connecting external storage to Nano ESP32.
Since Nano ESP32 features three hardware serial (UART) ports, excluding the USB serial port, I was able to connect multiple sensors requiring serial communication without a data transmission conflict.
As explained in the previous steps, the web application sorts the transferred data packet to save ultrasonic scan samples as text files named according to the assigned classes.
This AI-powered underwater air bubble detection device comprises two separate development boards — Nano ESP32 and UNIHIKER — performing interconnected features for data collection and running advanced AI models. Thus, the described code snippets show the different aspects of the same code file. Please refer to the code files below to inspect all interconnected functions in detail.
📁 AIoT_Aquatic_Ultrasonic_Imaging.ino
⭐ Include the required libraries.
#include <WiFi.h>
#include "DFRobot_RTU.h"
#include <DFRobot_WT61PC.h>
#include <OneWire.h>
#include <DallasTemperature.h>
#include <Adafruit_GFX.h>
#include <Adafruit_SSD1306.h>
⭐ Add the interface icons and the assigned class logos (converted C arrays) to be shown on the SSD1306 OLED display — logo.h.
#include "logo.h"
⭐ Define the required server configurations for the web application hosted on LattePanda 3 Delta 864.
⭐ Then, initialize the WiFiClient object.
char server[] = "192.168.1.22";
// Define the web application path.
String application = "/Aquatic_Ultrasonic_Imaging/";

// Initialize the WiFiClient object.
WiFiClient client; /* WiFiSSLClient client; */
⭐ Define the buffer (array) and allocate the buffer size to save the ultrasonic scan data items — a 20 x 20 image (400 data points).
#define scan_buffer_size  400
float ultrasonic_scan[scan_buffer_size] = {0};
⭐ Define the required configuration parameters and the address to register settings for the URM15 ultrasonic sensor.
#define SLAVE_ADDR  ((uint16_t)0x0F)

typedef enum{
  ePid,
  eVid,
  eAddr,
  eComBaudrate,
  eComParityStop,
  eDistance,
  eInternalTempreture,
  eExternTempreture,
  eControl
}eRegIndex_t;
⭐ Define the modbus object and assign the hardware serial port (Serial1) to obtain the information generated by the ultrasonic sensor via the RS485-to-UART signal adapter module.
DFRobot_RTU modbus(/*s =*/&Serial1);
⭐ Define the accelerometer object and assign the hardware serial port (Serial2) to obtain the information generated by the 6-axis accelerometer via serial communication.
DFRobot_WT61PC accelerometer(&Serial2);
⭐ Define the required configuration settings for the DS18B20 waterproof temperature sensor.
#define ONE_WIRE_BUS A1
OneWire oneWire(ONE_WIRE_BUS);
DallasTemperature DS18B20(&oneWire);
⭐ Configure the SSD1306 OLED display.
#define SCREEN_WIDTH 128 // OLED display width, in pixels
#define SCREEN_HEIGHT 64 // OLED display height, in pixels
#define OLED_RESET    -1 // Reset pin # (or -1 if sharing Arduino reset pin)

Adafruit_SSD1306 display(SCREEN_WIDTH, SCREEN_HEIGHT, &Wire, OLED_RESET);
⭐ Create a struct (_data) to list and access the information generated by the 6-axis accelerometer easily.
struct _data {
  float acc_x;
  float acc_y;
  float acc_z;
  float gyro_x;
  float gyro_y;
  float gyro_z;
  float ang_x;
  float ang_y;
  float ang_z;
};
⭐ Initialize the first hardware serial port (Serial1) to communicate with the URM15 ultrasonic sensor via the RS485-to-UART signal adapter module.
⭐ Initialize the second hardware serial port (Serial2) to communicate with the 6-axis accelerometer.
  Serial1.begin(19200, SERIAL_8N1, RX_1_PIN, TX_1_PIN);

  Serial2.begin(9600, SERIAL_8N1, RX_2_PIN, TX_2_PIN);
⭐ Set the URM15 ultrasonic sensor to trigger mode, select the external temperature compensation, and enable the temperature compensation function by overwriting the control register variable — byte (LSB).
  /*
     bit0:
      0 - select onboard temperature
      1 - select external temperature
     bit1:
      0 - enable temperature compensation function
      1 - disable temperature compensation function
     bit2:
      0 - activate auto detection
      1 - activate passive detection
     bit3:
      1 - read distance every 65 ms (in passive detection mode)
  */
  modbus.writeHoldingRegister(/*id =*/SLAVE_ADDR, /*reg =*/ eControl, /*val =*/0b00000001);
⭐ Initiate the 6-axis accelerometer and configure its data output frequency.
accelerometer.modifyFrequency(FREQUENCY_200HZ); /* FREQUENCY_0_1HZ, FREQUENCY_0_5HZ, FREQUENCY_1HZ, FREQUENCY_2HZ, FREQUENCY_5HZ, FREQUENCY_10HZ, FREQUENCY_20HZ, FREQUENCY_50HZ, FREQUENCY_100HZ, FREQUENCY_125HZ, FREQUENCY_200HZ */
⭐ Initialize the DS18B20 temperature sensor.
DS18B20.begin();
⭐ Attempt to connect to the given Wi-Fi network and wait for the successful network connection.
  WiFi.mode(WIFI_STA);
  WiFi.begin(ssid, pass);
  // Attempt to connect to the given Wi-Fi network.
  while(WiFi.status() != WL_CONNECTED){
    // Wait for the network connection.
    delay(500);
    Serial.print(".");
  }
  // If connected to the network successfully:
  Serial.println("Connected to the Wi-Fi network successfully!");
⭐ In the make_a_post_request function:
⭐ Connect to the web application named Aquatic_Ultrasonic_Imaging.
⭐ Create the query string by adding the given URL query (GET) parameters, including buffer data type, the selected class, and the detected label.
⭐ Define the boundary parameter named UltrasonicScan so as to send the generated ultrasonic scan data buffer (400 points) as a text (TXT) file to the web application.
⭐ Get the total content (data packet) length.
⭐ Make an HTTP POST request with the created query string to the web application in order to transfer the generated ultrasonic scan data buffer as a TXT file with the selected class or the label detected by the neural network model.
⭐ Wait until transferring the ultrasonic scan (text) buffer.
boolean make_a_post_request(String request){
  // Connect to the web application named Aquatic_Ultrasonic_Imaging. Change '80' with '443' if you are using SSL connection.
  if (client.connect(server, 80)){
    // If successful:
    Serial.println("\nConnected to the web application successfully!\n");
    // Create the query string:
    String query = application + request;
    // Make an HTTP POST request:
    String head = "--UltrasonicScan\r\nContent-Disposition: form-data; name=\"ultrasonic_scan\"; filename=\"new_scan.txt\"\r\nContent-Type: text/plain\r\n\r\n";
    String tail = "\r\n--UltrasonicScan--\r\n";
    // Get the total message length.
    uint32_t totalLen = head.length() + sizeof(ultrasonic_scan) + (scan_buffer_size*sizeof(char)) + tail.length();
    // Start the request:
    client.println("POST " + query + " HTTP/1.1");
    client.println("Host: 192.168.1.22");
    client.println("Content-Length: " + String(totalLen));
    client.println("Connection: Keep-Alive");
    client.println("Content-Type: multipart/form-data; boundary=UltrasonicScan");
    client.println();
    client.print(head);
    for(int i=0; i<scan_buffer_size; i++){ client.print(ultrasonic_scan[i]); client.print(",");}
    client.print(tail);
    // Wait until transferring the ultrasonic scan (text) buffer (20x20).
    delay(2000);
    // If successful:
    Serial.println("HTTP POST => Data transfer completed!\n");
    return true;
  }else{
    Serial.println("\nConnection failed to the web application!\n");
    delay(2000);
    return false;
  }
}
⭐ In the read_ultrasonic_sensor function:
⭐ Configure the external temperature value by utilizing the evaluated water temperature to generate precise distance measurements.
⭐ Obtain the temperature-compensated distance measurement produced by the URM15 ultrasonic sensor, except if the sensor is out of range.
void read_ultrasonic_sensor(float water_temp){
  // Configure the external temperature value by utilizing the evaluated water temperature to generate precise distance measurements.
  water_temp = water_temp*10;
  modbus.writeHoldingRegister(/*id =*/SLAVE_ADDR, /*reg =*/eExternTempreture, /*val =*/water_temp);
  delay(50);
  // Obtain the temperature-compensated distance measurement produced by the URM15 ultrasonic sensor.
  distance = modbus.readHoldingRegister(SLAVE_ADDR, eDistance);
  delay(50);
  // If the sensor is out of range, set the distance to -1.
  if(distance == 65535){
    distance = -1;
    Serial.println("Ultrasonic sensor is out of range!");
  }else{
    distance = distance/10;
  }
  delay(50);
}
⭐ In the read_accelerometer function, obtain the X, Y, and Z-axis movement variables generated by the 6-axis accelerometer — acceleration, angular velocity, and angle.
void read_accelerometer(){
  // Obtain the X, Y, and Z-axis measurements generated by the 6-axis accelerometer — acceleration, angular velocity, angle.
  if(accelerometer.available()){
    _acc.acc_x = accelerometer.Acc.X; _acc.acc_y = accelerometer.Acc.Y; _acc.acc_z = accelerometer.Acc.Z;
    _acc.gyro_x = accelerometer.Gyro.X; _acc.gyro_y = accelerometer.Gyro.Y; _acc.gyro_z = accelerometer.Gyro.Z;
    _acc.ang_x = accelerometer.Angle.X; _acc.ang_y = accelerometer.Angle.Y; _acc.ang_z = accelerometer.Angle.Z;
  }
}
⭐ In the get_temperature function, obtain the water temperature in Celsius, estimated by the DS18B20 waterproof temperature sensor.
float get_temperature(){
  // Obtain the temperature measurement in Celsius, estimated by the DS18B20 temperature sensor.
  DS18B20.requestTemperatures();
  float t = DS18B20.getTempCByIndex(0);
  delay(50);
  return t;
}
⭐ In the ultrasonic_imaging function:
⭐ Detect real-time device motions by reviewing the movement variables (X-axis and Y-axis) generated by the 6-axis accelerometer — acceleration and angular velocity.
⭐ If the device is gradually moving underwater within an arbitrary square, collect the temperature-compensated distance measurements produced by the URM15 ultrasonic sensor and save them as data points until completing the ultrasonic scan data buffer — 20 x 20 (400 points).
void ultrasonic_imaging(){
  // Define underwater device movements by utilizing the axis measurements generated by the 6-axis accelerometer — acceleration and angular velocity.
  if(_acc.acc_x > 0 && _acc.gyro_x > 0 && _acc.acc_y > 0 && _acc.gyro_y > 0){
    // If the device is moving underwater inside an arbitrary square, collect the temperature-compensated distance measurements produced by the URM15 ultrasonic sensor
    // and save them as data points to the scan data buffer — 20 x 20 (400 points).
    if(scanned_points < 399){
      scanned_points+=1;
      ultrasonic_scan[scanned_points] = distance/100;
      delay(50);
    }else{
      adjustColor(0,255,0);
      Serial.println("Scan Completed!");
      delay(50);
    }
  }
}
⭐ Change the highlighted menu option by operating the onboard control buttons — A and C.
⭐ Show the selected (highlighted) menu option with its assigned interface icon on the SSD1306 OLED display.
  if(!digitalRead(control_button_A)){
    menu_option-=1;
    if(menu_option < 0) menu_option = 4;
    delay(500);
  }
  if(!digitalRead(control_button_C)){
    menu_option+=1;
    if(menu_option > 4) menu_option = 0;
    delay(500);
  }

  // Show the interface (home) screen.
  show_interface("home", menu_option);
⭐ After selecting a menu option, if the control button B is pressed, navigate to the highlighted interface (menu) option.
⭐ If the first option (Show Readings) is activated:
⭐ Obtain the information produced by the ultrasonic sensor and the accelerometer.
⭐ Then, display the assigned interface logo and the retrieved sensor information on the SSD1306 screen for debugging.
⭐ If the control button D is pressed, redirect the user to the home screen.
  if(!digitalRead(control_button_B) && menu_option == 1){
    selected_interface[menu_option-1] = true;
    adjustColor(255,255,0);
    while(selected_interface[menu_option-1]){
      // Read multiple sensor data packets.
      read_ultrasonic_sensor(get_temperature());
      read_accelerometer();
      // Display the retrieved sensor information on the SSD1306 screen.
      show_interface("sensor", menu_option);
      // If the control button D is pressed, redirect the user to the home screen.
      if(!digitalRead(control_button_D)){
        selected_interface[menu_option-1] = false;
        adjustColor(0,0,0);
      }
    }
  }
⭐ If the second option (Ultrasonic+++) is activated:
⭐ Obtain the information produced by the ultrasonic sensor and the accelerometer.
⭐ Initiate the ultrasonic image scanning procedure and save data points until completing the scan buffer — 20 x 20 (400 points).
⭐ Display the ultrasonic scan progress (collected points) on the SSD1306 screen.
⭐ If the control button D is pressed, redirect the user to the home screen.
  if(!digitalRead(control_button_B) && menu_option == 2){
    selected_interface[menu_option-1] = true;
    adjustColor(0,255,255);
    // Clear the data buffer.
    scanned_points = -1;
    while(selected_interface[menu_option-1]){
      // Read multiple sensor data packets.
      read_ultrasonic_sensor(get_temperature());
      read_accelerometer();
      // Initiate the ultrasonic image scanning procedure.
      ultrasonic_imaging();
      // Display the ultrasonic scanning progress on the SSD1306 screen.
      show_interface("scan", menu_option);
      // If the control button D is pressed, redirect the user to the home screen.
      if(!digitalRead(control_button_D)){
        selected_interface[menu_option-1] = false;
        adjustColor(0,0,0);
      }
    }
  }
⭐ If the third option (Save Samples) is activated:
⭐ Display the selectable labels (air bubble classes) with their associated buttons.
⭐ Via the onboard control buttons (A and C), assign an air bubble class (normal or bubble) to the produced ultrasonic scan data buffer.
⭐ With the passed label, transfer the data type (sample or detection) and the given ultrasonic scan data buffer by making an HTTP POST request to the web application.
⭐ According to the data transmission success, notify the user by showing the associated connection icon on the screen.
⭐ If the control button D is pressed, redirect the user to the home screen.
  if(!digitalRead(control_button_B) && menu_option == 3){
    selected_interface[menu_option-1] = true;
    adjustColor(255,0,255);
    while(selected_interface[menu_option-1]){
      // Display the retrieved sensor information on the SSD1306 screen.
      show_interface("save", menu_option);
      // Depending on the passed air bubble class via the control buttons (A and C), transfer the collected ultrasonic scan data (buffer) to the web application via an HTTP POST request.
      if(!digitalRead(control_button_A)){
        if(make_a_post_request("?scan=OK&type=sample&class=normal")){
          // If successful:
          display.clearDisplay();
          display.drawBitmap((SCREEN_WIDTH-connected_width)/2, (SCREEN_HEIGHT-connected_height)/2, connected_bits, connected_width, connected_height, SSD1306_WHITE);
          display.display();
          adjustColor(0,255,0);
          delay(2000);
          adjustColor(255,0,255);
        }else{
          display.clearDisplay();
          display.drawBitmap((SCREEN_WIDTH-error_width)/2, (SCREEN_HEIGHT-error_height)/2, error_bits, error_width, error_height, SSD1306_WHITE);
          display.display();
          adjustColor(255,0,0);
          delay(2000);
          adjustColor(255,0,255);
        }
      }
      if(!digitalRead(control_button_C)){
        if(make_a_post_request("?scan=OK&type=sample&class=bubble")){
          // If successful:
          display.clearDisplay();
          display.drawBitmap((SCREEN_WIDTH-connected_width)/2, (SCREEN_HEIGHT-connected_height)/2, connected_bits, connected_width, connected_height, SSD1306_WHITE);
          display.display();
          adjustColor(0,255,0);
          delay(2000);
          adjustColor(255,0,255);
        }else{
          display.clearDisplay();
          display.drawBitmap((SCREEN_WIDTH-error_width)/2, (SCREEN_HEIGHT-error_height)/2, error_bits, error_width, error_height, SSD1306_WHITE);
          display.display();
          adjustColor(255,0,0);
          delay(2000);
          adjustColor(255,0,255);
        }
      }
      // If the control button D is pressed, redirect the user to the home screen.
      if(!digitalRead(control_button_D)){
        selected_interface[menu_option-1] = false;
        adjustColor(0,0,0);
      }
    }
  }
Step 15: Generating Aquatic Ultrasonic Scans Manifesting Air Bubbles and Saving Samples Via the Web Application


#️⃣ As explained earlier, I placed a lot of marimo moss balls at the bottom of the tank to increase the bottom surface area, provide underwater substrate gaps, and observe abundant noxious air bubbles while collecting ultrasonic scan data.
#️⃣ Thus, I managed to construct a valid data set for the neural network model.
🐠📡💧📊 If Nano ESP32 connects to the Wi-Fi network successfully, the device shows the home screen with the menu (interface) options on the SSD1306 screen.
- 1. Show Readings
- 2. Ultrasonic+++
- 3. Save Samples
- 4. Run Inference
🐠📡💧📊 The device lets the user change the highlighted menu option by pressing the control buttons — A (↓) and C (↑).
🐠📡💧📊 While the user adjusts the highlighted menu option, the device displays the associated interface icon on the screen.
🐠📡💧📊 After highlighting a menu option, if the control button B is pressed, the device navigates to the selected option.
🐠📡💧📊 After activating a menu option, the device returns to the home screen if the user presses the control button D.
🐠📡💧📊 If the user activates the first menu option — Show Readings:
🐠📡💧📊 The device displays the information produced by the ultrasonic sensor and the accelerometer on the SSD1306 screen for debugging.
🐠📡💧📊 Then, the device turns the RGB LED (connected to Nano ESP32) to yellow.
🐠📡💧📊 If the user activates the second menu option — Ultrasonic+++:
🐠📡💧📊 The device turns the RGB LED to cyan.
🐠📡💧📊 The device detects real-time motions while the ultrasonic sensor is submerged by reviewing the movement variables produced by the 6-axis accelerometer — acceleration and angular velocity.
🐠📡💧📊 If the device is gradually moving underwater within an arbitrary square, Nano ESP32 collects the temperature-compensated distance measurements produced by the ultrasonic sensor and save them as data points until concluding the ultrasonic scan buffer — 20 x 20 (400 points).
🐠📡💧📊 After initiating the ultrasonic image scanning procedure, the device shows the scan progress (collected points) on the SSD1306 screen.
🐠📡💧📊 When Nano ESP32 completes collecting 400 data points of the scan buffer, the device notifies the user via the screen and turns the RGB LED to green.
🐠📡💧📊 If the user activates the third menu option — Save Samples:
🐠📡💧📊 The device turns the RGB LED to magenta and displays the selectable labels (air bubble classes) with their associated buttons.
- A) Class => normal
- C) Class => bubble
🐠📡💧📊 Via the onboard control buttons (A and C), the device lets the user assign an air bubble class (normal or bubble) to the generated ultrasonic scan data buffer empirically.
🐠📡💧📊 After pressing a control button (A or C), the device transfers the passed label and the generated ultrasonic scan data buffer to the web application via an HTTP POST request.
🐠📡💧📊 If Nano ESP32 transfers the given data packet successfully to the web application, the device notifies the user by showing the assigned connection icon on the screen and turning the RGB LED to green.
🐠📡💧📊 After receiving the ultrasonic scan buffer, the web application saves the buffer as a text (TXT) file (data record) to the sample folder by adding the passed label and the collection date to the file name.
- sample_normal__2024_03_14_07_52_41.txt
- sample_bubble__2024_04_03_16_53_08.txt
Step 16: Applying Chemical Water Quality Tests to Analyze Water Contamination


Since all underwater air bubble activity cannot be singled out as an imminent toxic pollution risk, I decided to enable this air bubble detection device with the ability to assess potential water pollution based on chemical water quality tests.
Even though there are various water quality tests for fish tanks, I decided to utilize color-coded chemical tests produced by the renowned full-range supplier for aquariums, ponds, and terrariums — sera. In this regard, I was able to make the object detection model determine the water pollution levels easily by the color discrepancies of the applied water quality tests.
After researching the most common indicators of water pollution in a retail fish farm, in this case, my overpopulated medium-sized aquarium simulating harsh fish farm conditions, I decided to apply these four water quality tests regularly:
After following the provided instructions thoroughly for each chemical test and observing the water quality levels (color codes) from a new water change state to the peak of the underwater air bubble activity, I managed to group water pollution levels into three categories:
- sterile
- dangerous
- polluted
Step 17: Capturing Water Quality Test Result Images W/ the USB Webcam


After setting up the necessary software on UNIHIKER via SSH and installing the required modules, I programmed UNIHIKER to capture the water quality test result images with the USB webcam and save them as samples.
Since I wanted to provide a feature-rich user interface to capture water quality test result image samples, assign labels, and access the interconnected features, I decided to program an interactive user interface (GUI — Tkinter application) with the integrated Python modules. Since UNIHIKER provides an onboard touchscreen and two control buttons, I did not need to connect additional components to display the user interface. Via the micro:bit-compatible edge connector on the Squid PCB, I added a secondary RGB LED to inform the user of the device status while performing operations related to UNIHIKER.
As explained earlier, I managed to group water pollution levels into three categories. Thus, I added the corresponding pollution levels as labels to the file names of each sample while capturing images to create a valid data set for the object detection model.
This AI-powered underwater air bubble detection device, assessing water pollution based on chemical tests, comprises two separate development boards — UNIHIKER and Nano ESP32 — performing interconnected features for data collection and running advanced AI models. Thus, the described code snippets show the different aspects of the same code file. Please refer to the code files below to inspect all interconnected functions in detail.
📁 _class.py
To bundle all functions under a specific structure, I created a class named aquarium_func. In the following steps, I will clarify the remaining functions of this class. Please refer to the _class.py file to inspect all interconnected functions.
⭐ In the display_camera_feed function:
⭐ Obtain the real-time video stream (frames) generated by the high-quality USB webcam.
⭐ Resize the latest captured camera frame depending on the provided image sample sizes of the Edge Impulse object detection model.
⭐ Then, resize the same frame to display a snapshot of the latest captured camera frame on the onboard touchscreen.
⭐ Stop the real-time camera feed if requested.
    def display_camera_feed(self):
        # Display the real-time video stream generated by the USB webcam.
        ret, img = self.camera.read()
        # Resize the captured frame depending on the given object detection model.
        self.latest_frame_m = cv2.resize(img, self.frame_size_m)
        # Resize the same frame to display it on the UNIHIKER screen (snapshot).
        self.latest_frame_s = cv2.resize(img, self.frame_size_s)
        # Stop the camera feed if requested.
        if cv2.waitKey(1) & 0xFF == ord('q'):
            self.camera.release()
            cv2.destroyAllWindows()
            print("\nCamera Feed Stopped!")
⭐ In the take_snapshot function:
⭐ Save the latest snapshot frame to a temporary image file — snapshot — since the built-in Python module for Tkinter-based GUI does not support images as numpy arrays.
⭐ Then, show the snapshot image saved in the assets folder on the onboard touchscreen in order to notify the user of the latest captured camera frame.
⭐ Finally, store the latest image (depicted via the snapshot) resized according to the given model's frame sizes as the latest sample for further usage.
    def take_snapshot(self, filename="assets/snapshot"):
        # Show the latest camera frame (snapshot) on UNIHIKER to inform the user.
        cv2.imwrite("./"+filename, self.latest_frame_s)
        self.cam_snapshot_img.config(image=filename)
        # Store the latest modified image sample on the memory.
        self.modified_image = self.latest_frame_m
⭐ In the save_img_sample function:
⭐ If the user selects a pollution class via the built-in control button B (on UNIHIKER), create the file name of the image sample by adding the selected class and the collection date.
⭐ Then, save the latest stored frame to the samples folder via the built-in OpenCV functions and notify the user via the user interface (GUI).
    def save_img_sample(self, given_class):
        if(given_class > -1):
            # Create the file name for the image sample.
            date = datetime.datetime.now().strftime("%Y%m%d_%H%M%S")
            filename = "IMG_{}_{}".format(self.class_names[given_class], date)
            # Save the modified image sample.
            cv2.imwrite("./samples/"+filename, self.modified_image)
            print("\nSample Saved Successfully: ./samples/" + filename)
            # Notify the user.
            self.cam_info_text.config(text="Saved: "+filename)
        else:
            self.cam_info_text.config(text="Please select a class.")
#️⃣ Since UNIHIKER provides a built-in Python module tailored for displaying a Tkinter-based GUI on its onboard touchscreen (240 x 320), I was able to program the interactive user interface effortlessly.
#️⃣ Although the built-in module supports limited Tkinter features, I managed to create a multi-window user interface by shifting groups of GUI elements on and off-screen.
#️⃣ The interactive user interface (GUI) consists of three separate windows (layers):
- Home
- Aquatic Ultrasonic Scan
- Water Quality Test
⭐ In the create_user_interface function:
⭐ Design the feature-rich user interface via the provided unihiker module.
⭐ Group the generated GUI elements and their screen coordinates into separate arrays for each interface section (layer) so as to navigate windows effortlessly.
⭐ To add callback functions to the GUI elements, utilize the onclick parameter (triggered when the element is clicked) and the lambda expression.
    def create_user_interface(self, _x=120, _y=10, offset=15, origin="top_left"):
        # Design the user interface (GUI) via the built-in unihiker module.
        # Camera interface for AI-based chemical water quality test.
        self.cam_backg = self.interface.fill_rect(x=0, y=0, w=240, h=320, color="#9BB5CE")
        self.cam_snapshot_img = self.interface.draw_image(x=60, y=5, image="assets/cam_wait", origin=origin, onclick=lambda:self.interface_config("clear_class"))
        self.cam_section = self.interface.fill_round_rect(x=5, y=130, r=10, w=230, h=185, color="#215E7C")
        self.cam_run_button = self.interface.fill_round_rect(x=45, y=250, r=5, w=150, h=45, color="#FAE0D8", onclick=self.run_inference)
        self.cam_run_text = self.interface.draw_text(x=120, y=272, text="Run Inference", origin="center", color="#5C5B57", font_size=12, onclick=self.run_inference)
        self.cam_save_button = self.interface.fill_round_rect(x=45, y=195, r=5, w=150, h=45, color="#FAE0D8", onclick=lambda:self.save_img_sample(self.selected_class))
        self.cam_save_text = self.interface.draw_text(x=120, y=217, text="Capture Sample", origin="center", color="#5C5B57", font_size=12, onclick=lambda:self.save_img_sample(self.selected_class))
        self.cam_snap_button = self.interface.fill_round_rect(x=45, y=140, r=5, w=150, h=45, color="#FAE0D8", onclick=self.take_snapshot)
        self.cam_snap_text = self.interface.draw_text(x=120, y=162, text="Snapshot", origin="center", color="#5C5B57", font_size=12)
        self.cam_info_text = self.interface.draw_text(x=120, y=305, text="Pending...", origin="center", color="white", font_size=8)
        # Elements and coordinates — Camera.
        self.cam_int_vars = [self.cam_backg, self.cam_snapshot_img, self.cam_section, self.cam_run_button, self.cam_run_text, self.cam_save_button, self.cam_save_text, self.cam_snap_button, self.cam_snap_text, self.cam_info_text]
        self.cam_int_vals = [0, 60, 5, 45, 120, 45, 120, 45, 120, 120]
        # Ultrasonic sensor interface for AI-based ultrasonic imaging.
        self.ultra_backg = self.interface.fill_rect(x=0, y=0, w=240, h=320, color="#5C5B57")
        self.ultrasonic_img = self.interface.draw_image(x=20, y=0, image="assets/ultrasonic_temp", origin=origin, onclick=lambda:self.telegram_send_data("ultrasonic", "6465514194"))
        self.ultra_section = self.interface.fill_round_rect(x=5, y=205, r=10, w=230, h=110, color="#F9E5C9")
        self.ultra_ins_button = self.interface.fill_round_rect(x=45, y=260, r=5, w=150, h=35, color="#F5F5F0", onclick=lambda:self.make_a_get_request("get_model_result"))
        self.ultra_ins_text = self.interface.draw_text(x=120, y=277, text="Generate Image", origin="center", color="#5C5B57", font_size=12, onclick=lambda:self.make_a_get_request("get_model_result"))
        self.ultra_gen_button = self.interface.fill_round_rect(x=45, y=215, r=5, w=150, h=35, color="#F5F5F0", onclick=lambda:self.make_a_get_request("csv"))
        self.ultra_gen_text = self.interface.draw_text(x=120, y=232, text="Generate CSV", origin="center", color="#5C5B57", font_size=12, onclick=lambda:self.make_a_get_request("csv"))
        self.ultra_info_text = self.interface.draw_text(x=120, y=305, text="Pending...", origin="center", color="#5C5B57", font_size=8)
        # Elements and coordinates — Ultrasonic Sensor.
        self.ultra_int_vars = [self.ultra_backg, self.ultrasonic_img, self.ultra_section, self.ultra_ins_button, self.ultra_ins_text, self.ultra_gen_button, self.ultra_gen_text, self.ultra_info_text]
        self.ultra_int_vals = [0, 20, 5, 45, 120, 45, 120, 120]
        # Home screen.
        self.main_backg = self.interface.draw_image(x=0, y=0, image="assets/background", origin=origin, onclick=lambda:self.adjust_color([0,0,0]))
        self.main_ultra_button = self.interface.fill_round_rect(x=20, y=10, r=5, w=200, h=45, color="#5C5B57", onclick=lambda:self.interface_config("ultra"))
        self.main_ultra_text = self.interface.draw_text(x=120, y=32, text="Aquatic Ultrasonic Scan", origin="center", color="white", font_size=12, onclick=lambda:self.interface_config("ultra"))
        self.main_cam_button = self.interface.fill_round_rect(x=20, y=265, r=5, w=200, h=45, color="#9BB5CE", onclick=lambda:self.interface_config("cam"))
        self.main_cam_text = self.interface.draw_text(x=120, y=287, text="Water Quality Test", origin="center", color="white", font_size=12, onclick=lambda:self.interface_config("cam"))
        # Elements and coordinates — Home Screen.
        self.home_int_vars = [self.main_backg, self.main_ultra_button, self.main_ultra_text, self.main_cam_button, self.main_cam_text]
        self.home_int_vals = [0, 20, 120, 20, 120]
⭐ In the board_configuration function:
⭐ Employ the built-in control buttons on UNIHIKER to provide a versatile user experience.
⭐ If the control button A (UNIHIKER) is pressed, navigate to the home screen.
⭐ If the control button B (UNIHIKER) is pressed, change the selected pollution class incrementally and adjust the background color of the Capture Sample button under the Water Quality Test section accordingly.
⭐ Also, adjust the secondary RGB LED according to the assigned class color.
    def board_configuration(self):
        # Utilize the integrated sensors on UNIHIKER to provide a feature-rich user experience.
        while True:
            # If the control button A is pressed, return to the home screen.
            if button_a.is_pressed() == True:
                self.interface_config("home")
                sleep(1)
            # If the control button B is pressed, change the selected class.
            if button_b.is_pressed() == True:
                self.selected_class+=1
                if self.selected_class == 3:
                    self.selected_class = 0
                self.cam_save_button.config(color=self.class_colors[self.selected_class])
                if(self.selected_class == 0): self.adjust_color([0,1,0])
                if(self.selected_class == 1): self.adjust_color([1,1,0])
                if(self.selected_class == 2): self.adjust_color([1,0,0])
                sleep(1)
⭐ In the interface_config function:
⭐ Depending on the passed command, process the GUI elements and their screen coordinates grouped under separate arrays for each section to shift windows (layers) effortlessly.
⭐ If requested, clear the selected pollution class.
    def interface_config(self, con, _hide=350):
        if(con == "home"):
            for i in range(len(self.home_int_vals)):
                self.home_int_vars[i].config(x=self.home_int_vals[i])
            for i in range(len(self.cam_int_vals)):
                self.cam_int_vars[i].config(x=_hide)
            for i in range(len(self.ultra_int_vals)):
                self.ultra_int_vars[i].config(x=_hide)
            self.adjust_color([0,0,0])
        elif(con == "cam"):
            for i in range(len(self.home_int_vals)):
                self.home_int_vars[i].config(x=_hide)
            for i in range(len(self.cam_int_vals)):
                self.cam_int_vars[i].config(x=self.cam_int_vals[i])
            for i in range(len(self.ultra_int_vals)):
                self.ultra_int_vars[i].config(x=_hide)
            self.adjust_color([0,1,1])
        elif(con == "ultra"):
            for i in range(len(self.home_int_vals)):
                self.home_int_vars[i].config(x=_hide)
            for i in range(len(self.cam_int_vals)):
                self.cam_int_vars[i].config(x=_hide)
            for i in range(len(self.ultra_int_vals)):
                self.ultra_int_vars[i].config(x=self.ultra_int_vals[i])
            self.adjust_color([1,0,1])
        elif(con == "clear_class"):
            self.selected_class = -1
            self.cam_save_button.config(color="#FAE0D8")
            self.cam_info_text.config(text="Pending...")
            self.adjust_color([0,0,0])
Step 18: Saving the Captured Images Via the Interactive User Interface (GUI)


Since the captured camera frame size is not compatible with the object detection model, I utilized the built-in OpenCV features to resize the captured frame according to the required dimensions for both the model and the user interface (snapshot).
After executing the main.py file on UNIHIKER:
🐠📡💧📊 The device displays the home screen, showing two main sections, on the built-in touchscreen of UNIHIKER.
- Aquatic Ultrasonic Scan
- Water Quality Test
🐠📡💧📊 If the user clicks the Water Quality Test button, the device opens the Water Quality Test section.
🐠📡💧📊 While obtaining real-time frames produced by the high-quality USB webcam, the device resizes the latest captured camera frame depending on the provided image frame size of the Edge Impulse object detection model.
🐠📡💧📊 Also, the device resizes the same frame as a smaller snapshot of the latest captured camera frame.
🐠📡💧📊 When the user clicks the Snapshot button, the device saves the latest generated snapshot image to a temporary image file since the built-in Python module for Tkinter-based GUI does not support images as numpy arrays. Then, the device stores the latest frame modified by the model frame size.
🐠📡💧📊 After saving frames, the device shows the latest snapshot image on the onboard touchscreen in order to notify the user of the latest stored camera frame.
🐠📡💧📊 If the user clicks the onboard control button B (on UNIHIKER), the device changes the selected pollution class incrementally and adjusts the background color of the Capture Sample button according to the assigned class color.
- Green ➡ sterile
- Yellow ➡ dangerous
- Red ➡ polluted
🐠📡💧📊 After selecting a pollution class successfully, the device lets the user save an image sample by clicking the Capture Sample button.
🐠📡💧📊 To construct a comprehensive image data set, the device adds the selected class (label) and the collection date to each image sample file name.
IMG_sterile_20240330_120423
After collecting image samples of chemical water quality test results (color-coded), I constructed a valid and notable image data set for the object detection model.
Step 19: Building a Neural Network Model W/ Edge Impulse Enterprise
As explained earlier, I set up a freshwater aquarium to simulate the harsh fish farm conditions leading to noxious air bubbles lurking in the underwater substrate.
Then, I utilized the URM15 (waterproof) ultrasonic sensor to generate ultrasonic scan buffers of the bottom of the tank, consisting of 400 data points as a 20 x 20 ultrasonic image. While collecting and saving aquatic ultrasonic scan buffers, I empirically differentiated the produced samples (data records) depending on the presence of toxic air bubbles:
- normal
- bubble
When I completed collecting aquatic ultrasonic scan data buffers via the web application, I started to work on my artificial neural network model (ANN) to identify toxic underwater air bubbles manifesting potential water pollution risk.
Since Edge Impulse provides developer-friendly tools for advanced AI applications and supports almost every development board due to its model deployment options, I decided to utilize Edge Impulse Enterprise to build my artificial neural network model. Also, Edge Impulse Enterprise incorporates state-of-the-art machine learning algorithms and scales them for edge devices such as Nano ESP32.
Furthermore, Edge Impulse provides an accessible tool named CSV Wizard, which lets the user inspect a single CSV file, select the data type, obtain the label and data item fields from the given header, and register the configuration settings for the subsequent CSV files.
Since I employed the web application to follow the steps below to generate a pre-formatted CSV file from all ultrasonic scan buffer samples saved as text files and to sort data items, I was able to process my data set effortlessly so as to train my neural network model accurately:
- Data Scaling (Resizing)
- Data Labeling
After processing my data set, I decided to apply an advanced machine learning algorithm to train my neural network model, considering the unique and intricate structure of aquatic ultrasonic imaging data. After conducting various experiments with different model classifiers on Edge Impulse, I employed the Ridge classifier supported by Edge Impulse Enterprise since it has provided the most accurate precision results for identifying underwater air bubbles.
As a logistic regression method with L2 regularization, the Ridge classification combines conventional classification techniques and the Ridge regression for multi-class classification tasks. Since the integrated L2 regularization lets the user penalize unnecessary features to enhance the model performance and control the penalization rate, the Ridge classifier gives the trained model the ability to adapt classification results to a regression framework and prevent overfitting via the adjusted hyperparameter alpha, regulating how the penalty affects the model coefficients.
Plausibly, Edge Impulse Enterprise allows building predictive models with enhanced machine learning algorithms optimized in size and accuracy and deploying the trained model as an Arduino library. Therefore, after formatting and processing my data set, I was able to build a valid neural network model with the Ridge classifier to identify toxic underwater air bubbles and run the optimized model on Nano ESP32 without any additional requirements.
You can inspect my neural network model with the Ridge classifier on Edge Impulse as a public project.
Step 20: Uploading and Processing Samples


After generating training and testing samples successfully, I uploaded them to my project on Edge Impulse Enterprise.
#️⃣ First of all, to utilize the incorporated tools for advanced AI applications, sign up for Edge Impulse Enterprise.
#️⃣ Then, create a new project under your organization.
#️⃣ Open the Data acquisition page and go to the CSV Wizard section.
#️⃣ Upload a CSV file as an example to set the configuration settings (rules) for processing files via CSV Wizard.
#️⃣ Define the data structure (time-series data or not) of the records in the passed CSV file.
#️⃣ Select the column (data field) containing labels for the given data records.
#️⃣ Then, determine the columns containing values to split a data record into data items and click Finish wizard.
#️⃣ After setting the CSV rules, navigate to the Data acquisition page and click the Upload data icon.
#️⃣ Choose the data category (training or testing) and select a CSV file.
#️⃣ Then, click the Upload data button to upload samples labeled automatically with the values in the specified column (data field).
Step 21: Training the Model on Aquatic Ultrasonic Scan Buffers


After uploading and labeling my training and testing samples successfully, I designed an impulse and trained the model to identify noxious underwater air bubbles.
An impulse is a custom neural network model in Edge Impulse. I created my impulse by employing the Raw Data processing block and the Classification learning block.
The Raw Data processing block generates windows from data samples without applying any specific signal processing procedures.
The Classification learning block represents a Keras neural network model. This learning block lets the user change the model classifier, settings, architecture, and layers.
#️⃣ After navigating to the Create impulse page, select the Raw Data processing block and the Classification learning block. Then, click Save Impulse.
#️⃣ Before generating features for the neural network model, go to the Raw data page and click Save parameters.
#️⃣ After saving parameters, click Generate features to apply the Raw Data processing block to training samples.
#️⃣ Then, navigate to the Classifier page.
#️⃣ To change the default model classifier, click the Add an extra layer button and select the scikit-learn Ridge classifier employing L2 regularization.
#️⃣ After configuring the model classifier, click Start training.
According to my experiments with my neural network model with the Ridge classifier, I modified the classification settings and the hyperparameter alpha to build a neural network model with high accuracy and validity:
📌 Neural network settings:
- Alpha ➡ 0.4
- Validation set size ➡ 5
After generating features and training my model with training samples, Edge Impulse evaluated the precision score (accuracy) as 100%.
The precision score (accuracy) is approximately 100% due to the modest volume of validation samples of ultrasonic scan buffers demonstrating toxic underwater air bubbles. As compared to other supported classifiers, the Ridge classifier produced the most accurate detections after adjusting the regularization strength according to my data set. Since I configured my neural network model to conform to my aquarium's conditions, I highly recommend retraining the model with aquatic ultrasonic scan samples from the targeted fish farm before running inferences to identify underwater air bubbles.
Step 22: Evaluating the Model Accuracy and Deploying the Model


After building and training my neural network model with the Ridge classifier, I tested its accuracy and validity by utilizing testing samples.
The evaluated accuracy of the model is 100%.
#️⃣ To validate the trained model, go to the Model testing page and click Classify all.
After validating my neural network model, I deployed it as a fully optimized and customizable Arduino library.
#️⃣ To deploy the validated model as an Arduino library, navigate to the Deployment page and search for Arduino library.
#️⃣ Then, choose the default Unoptimized (float32) option since the Quantized (int8) optimization option is not available for the Ridge classifier.
#️⃣ Finally, click Build to download the model as an Arduino library.
Step 23: Building an Object Detection (NVIDIA TAO RetinaNet) Model W/ Edge Impulse Enterprise
When I completed capturing images of chemical water quality test results (color-coded) representing the most common indicators of water contamination in a retail fish farm and storing the captured samples on UNIHIKER, I started to work on my object detection (RetinaNet) model to assess water pollution levels.
Since Edge Impulse provides developer-friendly tools for advanced edge AI applications and supports almost every development board due to its model deployment options, I decided to utilize Edge Impulse Enterprise to build my object detection model. Also, Edge Impulse Enterprise incorporates elaborate model architectures for advanced computer vision applications and optimizes the state-of-the-art vision models for edge devices such as UNIHIKER.
Since assessing water pollution levels based on the applied chemical water quality tests (color-coded) is a complex computer vision task, I decided to employ an enhanced vision model architecture. After conducting experiments with the advanced algorithms supported by Edge Impulse Enterprise, I decided to utilize RetinaNet from the NVIDIA TAO Toolkit.
NVIDIA TAO Toolkit is a low-code AI toolkit built on TensorFlow and PyTorch, which simplifies the model training process and lets developers select one of 100+ pre-trained vision AI models with customization options. TAO provides an extensive selection of pre-trained models, either trained on public datasets or proprietary datasets for task-specific use cases. Since Edge Impulse Enterprise incorporates production-tested NVIDIA TAO vision models and provides configurable backbones (MobileNetV2, GoogLeNet, ResNet, etc.), fine-tuning RetinaNet to unique data sets and deploying optimized models for edge devices are efficient and user-friendly on Edge Impulse.
Even though Edge Impulse supports JPG or PNG files to upload as samples directly, each target object in a training or testing sample needs to be labeled manually. Therefore, I needed to follow the steps below to format my data set so as to train my object detection model accurately:
- Data Scaling (Resizing)
- Data Labeling
As explained earlier, I managed to group water pollution levels into three categories empirically while observing the water quality levels after applying chemical color-coded tests.
Since I added the mentioned pollution categories and the collection date to the file names while capturing images of water quality test results (color-coded), I preprocessed my data set effortlessly to label each target object on an image sample on Edge Impulse by utilizing the assigned pollution category:
- sterile
- dangerous
- polluted
Plausibly, Edge Impulse Enterprise allows building advanced computer vision models optimized in size and accuracy efficiently and deploying the trained model as a supported firmware (Linux AARCH64) for UNIHIKER. Therefore, after scaling (resizing) and processing my image data set to label target objects, I was able to build a valid object detection model to assess water pollution based on the applied water quality tests, which runs on UNIHIKER without any additional requirements.
You can inspect my object detection (RetinaNet) model on Edge Impulse as a public project.
Step 24: Uploading Images (samples) and Labeling Objects


After collecting training and testing image samples, I uploaded them to my project on Edge Impulse. Then, I labeled each target object on the image samples.
#️⃣ First of all, to utilize the incorporated tools for advanced AI applications, sign up for Edge Impulse Enterprise.
#️⃣ Then, create a new project under your organization.
#️⃣ To be able to label image samples manually on Edge Impulse for object detection models, go to Dashboard ➡ Project info ➡ Labeling method and select Bounding boxes (object detection).
#️⃣ Navigate to the Data acquisition page and click the Upload data icon.
#️⃣ Then, choose the data category (training or testing), select image files, and click the Upload data button.
After uploading my image data set successfully, I labeled each target object on the image samples by utilizing the assigned water pollution categories (classes). In Edge Impulse, labeling an object is as easy as dragging a box around it and entering a class. Also, Edge Impulse runs a tracking algorithm in the background while labeling objects, so it moves the bounding boxes automatically for the same target objects in subsequent images.
#️⃣ Go to Data acquisition ➡ Labeling queue. It shows all unlabeled items (training and testing) remaining in the given data set.
#️⃣ Finally, select an unlabeled item, drag bounding boxes around target objects, click the Save labels button, and repeat this process until all samples have at least one labeled target object.
Step 25: Training the RetinaNet Model on the Water Quality Test Images


After labeling target objects on my training and testing samples successfully, I designed an impulse and trained the model on detecting water pollution levels based on the applied chemical water quality tests.
An impulse is a custom neural network model in Edge Impulse. I created my impulse by employing the Image preprocessing block and the Object Detection (Images) learning block.
The Image preprocessing block optionally turns the input image format to grayscale or RGB and generates a features array from the raw image.
The Object Detection (Images) learning block represents a machine learning algorithm that detects objects on the given image, distinguished between model labels.
In this case, I configured the input image format as RGB since the applied chemical water quality tests highly rely on color codes to distinguish quality levels.
Due to the NVIDIA TAO vision model requirements, the image width and height must be multiples of 32 while configuring the impulse.
#️⃣ Go to the Create impulse page and set image width and height parameters to 320. Then, select the resize mode parameter as Fit shortest axis so as to scale (resize) given training and testing image samples.
#️⃣ Select the Image preprocessing block and the Object Detection (Images) learning block. Finally, click Save Impulse.
#️⃣ Before generating features for the object detection model, go to the Image page and set the Color depth parameter as RGB. Then, click Save parameters.
#️⃣ After saving parameters, click Generate features to apply the Image preprocessing block to training image samples.
#️⃣ After generating features successfully, navigate to the Object detection page.
To change the default computer vision model (algorithm), click the Choose a different model button and select the NVIDIA TAO RetinaNet model, providing superior performance on smaller objects.
Then, switch to GPU training since NVIDIA TAO models are GPU-optimized computer vision algorithms.
#️⃣ After configuring the model settings, click Start training.
According to my rigorous experiments with my RetinaNet object detection model, I modified the model and augmentation settings to fine-tune the MobileNet v2 backbone so as to build an optimized object detection model with high accuracy and validity:
📌 Object Detection (Images) settings:
- Backbone ➡ MobileNet v2 (3x224x224, 800 K params)
- Number of training cycles ➡ 200
- Minimum learning rate ➡ 0.012
- Maximum learning rate ➡ 0.015
- Random crop min scale ➡ 1.0
- Random crop max scale ➡ 1.0
- Random crop min aspect ratio ➡ 0.1
- Random crop max aspect ratio ➡ 0.1
- Zoom out min scale ➡ 1.0
- Zoom out max scale ➡ 1.0
- Validation set size ➡ 5
- IoU threshold ➡ 0.95
- Confidence threshold ➡ 0.001
- Batch size ➡ 16
📌 Neural network architecture:
- NVIDIA TAO RetinaNet (ENTERPRISE)
After generating features and training my RetinaNet model with training samples, Edge Impulse evaluated the precision score (accuracy) as 65.2%.
The precision score (accuracy) is approximately 66% due to the small volume of validation image samples of color-coded chemical water quality test results. Since the validation set only consists of two water pollution categories, the model attempts to validate only the passed categories (classes) instead of three while training. Therefore, I highly recommend retraining the model with the image samples of the water quality tests applied to the targeted retail fish farm before running inferences.
Step 26: Evaluating the Model Accuracy and Deploying the Optimized Model


After building and training my RetinaNet object detection model, I tested its accuracy and validity by utilizing testing image samples.
The evaluated accuracy of the model is 88.89%.
#️⃣ To validate the trained model, go to the Model testing page and click Classify all.
After validating my object detection model, I deployed it as a fully optimized and customizable Linux (AARCH64) application (.eim).
#️⃣ To deploy the validated model as a Linux (AARCH64) application, navigate to the Deployment page and search for Linux (AARCH64).
#️⃣ Then, choose the Quantized (int8) optimization option to get the best performance possible while running the deployed model.
#️⃣ Finally, click Build to download the model as a Linux (AARCH64) application (.eim).
Step 27: Setting Up the Neural Network Model on Nano ESP32


After building, training, and deploying my neural network model with the Ridge classifier as an Arduino library on Edge Impulse, I needed to upload the generated Arduino library on Nano ESP32 to run the optimized model directly so as to identify toxic underwater air bubbles with minimal latency, memory usage, and power consumption.
Since Edge Impulse optimizes and formats signal processing, configuration, and learning blocks into a single package while deploying models as Arduino libraries, even for complex machine learning algorithms, I was able to import my advanced model effortlessly to run inferences.
#️⃣ After downloading the model as an Arduino library in the ZIP file format, go to Sketch ➡ Include Library ➡ Add .ZIP Library...
#️⃣ Then, include the Aquatic_Air_Bubble_Detection_inferencing.h file to import the Edge Impulse neural network model with the Ridge classifier.
#include <Aquatic_Air_Bubble_Detection_inferencing.h>
After importing my model successfully to the Arduino IDE, I programmed Nano ESP32 to run inferences to identify noxious underwater air bubbles via aquatic ultrasonic scans.
Then, I employed Nano ESP32 to transfer the model detection results (buffer passed to the model and the detected air bubble class) to the web application via an HTTP POST request after running an inference successfully.
As mentioned earlier, the web application can also communicate with UNIHIKER to allow the user to access the stored model detection results in order to provide interconnected features.
Since the interconnected features for data collection and running advanced AI models are performed by two separate development boards (Nano ESP32 and UNIHIKER), the described code snippets show the different aspects of the same code file. Please refer to the code files below to inspect all interconnected functions in detail.
📁 AIoT_Aquatic_Ultrasonic_Imaging.ino
⭐ Define the required parameters to run an inference with the Edge Impulse neural network model with the Ridge classifier.
#define sample_buffer_size 400
⭐ Define the threshold value (0.60) for the model outputs (predictions).
⭐ Define the air bubble class names.
float threshold = 0.60;

// Define the air bubble class names:
String classes[] = {"bubble", "normal"};
⭐ In the run_inference_to_make_predictions function:
⭐ Summarize the Edge Impulse neural network model inference settings and print them on the serial monitor.
⭐ If the URM15 ultrasonic sensor produces an ultrasonic scan data buffer (20 x 20 image — 400 points) successfully:
⭐ Create a signal object from the resized (scaled) raw data buffer — ultrasonic scan buffer.
⭐ Run an inference with the Ridge classifier.
⭐ Print the inference timings on the serial monitor.
⭐ Obtain the prediction results for each label (class).
⭐ Print the model classification results on the serial monitor.
⭐ Get the imperative predicted label (class).
⭐ Print inference anomalies on the serial monitor, if any.
⭐ Release the previously generated ultrasonic scan buffer if requested.
void run_inference_to_make_predictions(bool _r){
  // Summarize the Edge Impulse neural network model inference settings (from model_metadata.h):
  Serial.print("\nInference settings:\n");
  Serial.print("\tInterval: "); Serial.print((float)EI_CLASSIFIER_INTERVAL_MS); Serial.print(" ms.\n");
  Serial.printf("\tFrame size: %d\n", EI_CLASSIFIER_DSP_INPUT_FRAME_SIZE);
  Serial.printf("\tSample length: %d ms.\n", EI_CLASSIFIER_RAW_SAMPLE_COUNT / 16);
  Serial.printf("\tNo. of classes: %d\n", sizeof(ei_classifier_inferencing_categories) / sizeof(ei_classifier_inferencing_categories[0]));

  // If the URM15 ultrasonic sensor generates an ultrasonic scan buffer (20 x 20 — 400 points) successfully:
  if(ultrasonic_scan[scan_buffer_size-1] > 0){
    // Run inference:
    ei::signal_t signal;
    // Create a signal object from the resized (scaled) raw data buffer — ultrasonic scan buffer.
    numpy::signal_from_buffer(ultrasonic_scan, EI_CLASSIFIER_DSP_INPUT_FRAME_SIZE, &signal);
    // Run the classifier:
    ei_impulse_result_t result = { 0 };
    EI_IMPULSE_ERROR _err = run_classifier(&signal, &result, false);
    if(_err != EI_IMPULSE_OK){
      Serial.printf("ERR: Failed to run classifier (%d)\n", _err);
      return;
    }

    // Print the inference timings on the serial monitor.
    Serial.printf("\nPredictions (DSP: %d ms., Classification: %d ms., Anomaly: %d ms.): \n",
        result.timing.dsp, result.timing.classification, result.timing.anomaly);

    // Obtain the prediction results for each label (class).
    for(size_t ix = 0; ix < EI_CLASSIFIER_LABEL_COUNT; ix++){
      // Print the prediction results on the serial monitor.
      Serial.printf("\t%s:\t%.5f\n", result.classification[ix].label, result.classification[ix].value);
      // Get the imperative predicted label (class).
      if(result.classification[ix].value >= threshold) predicted_class = ix;
    }
    Serial.printf("\nPredicted Class: %d [%s]\n", predicted_class, classes[predicted_class]);

    // Detect anomalies, if any:
    #if EI_CLASSIFIER_HAS_ANOMALY == 1
      Serial.printf("Anomaly: %d \n", result.anomaly);
    #endif

    // Release the ultrasonic scan buffer if requested.
    if(!_r){ for(int i=0; i<scan_buffer_size; i++){ ultrasonic_scan[i] = 0; } }

  }else{
    Serial.println("\nUltrasonic scan data buffer => Empty!");
  }
}
⭐ In the show_interface function:
⭐ Create the home screen and menu option layouts with the assigned interface icons so as to elevate the user experience with an enhanced user interface.
void show_interface(String com, int menu_option){
  // Get the assigned interface logo information.
  int l_w = interface_widths[menu_option];
  int l_h = interface_heights[menu_option];
  if(com == "home"){
    display.clearDisplay();
    display.drawBitmap(0, (SCREEN_HEIGHT-l_h)/2, interface_logos[menu_option], l_w, l_h, SSD1306_WHITE);
    display.setTextSize(1);
    (menu_option == 1) ? display.setTextColor(SSD1306_BLACK, SSD1306_WHITE) : display.setTextColor(SSD1306_WHITE);
    display.setCursor(l_w+5, 5);
    display.println("1.Show Readings");
    (menu_option == 2) ? display.setTextColor(SSD1306_BLACK, SSD1306_WHITE) : display.setTextColor(SSD1306_WHITE);
    display.setCursor(l_w+5, 20);
    display.println("2.Ultrasonic+++");
    (menu_option == 3) ? display.setTextColor(SSD1306_BLACK, SSD1306_WHITE) : display.setTextColor(SSD1306_WHITE);
    display.setCursor(l_w+5, 35);
    display.println("3.Save Samples");
    (menu_option == 4) ? display.setTextColor(SSD1306_BLACK, SSD1306_WHITE) : display.setTextColor(SSD1306_WHITE);
    display.setCursor(l_w+5, 50);
    display.println("4.Run Inference");
    display.display();
    delay(500);
  }
  else if(com == "sensor"){
    display.clearDisplay();
    display.drawBitmap(SCREEN_WIDTH-l_w, SCREEN_HEIGHT-l_h, interface_logos[menu_option], l_w, l_h, SSD1306_WHITE);
    display.setTextSize(1);
    display.setCursor(0, 0);
    display.print("Distance: "); display.print(distance); display.println("cm");
    display.setCursor(0, 20);
    display.print("X: "); display.print(_acc.acc_x); display.print(" / "); display.print(_acc.gyro_x);
    display.setCursor(0, 30);
    display.print("Y: "); display.print(_acc.acc_y); display.print(" / "); display.print(_acc.gyro_y);
    display.setCursor(0, 40);
    display.print("Z: "); display.print(_acc.acc_z); display.print(" / "); display.print(_acc.gyro_z);
    display.display();
  }
  else if(com == "scan"){
    display.clearDisplay();
    display.drawBitmap(SCREEN_WIDTH-l_w, SCREEN_HEIGHT-l_h, interface_logos[menu_option], l_w, l_h, SSD1306_WHITE);
    display.setTextSize(2);
    display.setCursor(0, 0);
    display.print(scanned_points+1); display.println(" / 400");
    display.setTextSize(1);
    display.setCursor(0, 25);
    (scanned_points < 399) ? display.print("Scanning...") : display.print("Scan Completed!");
    display.display();
  }
  else if(com == "save"){
    display.clearDisplay();
    display.drawBitmap((SCREEN_WIDTH-l_w)/2, 0, interface_logos[menu_option], l_w, l_h, SSD1306_WHITE);
    display.setTextSize(1);
    display.setCursor(0, l_h+10);
    display.print("A) Class => normal");
    display.setCursor(0, l_h+25);
    display.print("C) Class => bubble");
    display.display();
  }
  else if(com == "run"){
    display.clearDisplay();
    display.setTextSize(1);
    display.setTextColor(SSD1306_WHITE);
    display.setCursor(0, l_h+5);
    display.print("A) Run Inference");
    display.setCursor(0, l_h+20);
    // Show the latest model detection result and the assigned class icon if the model yields a label successfully.
    String r = (predicted_class > -1) ? classes[predicted_class] : "Pending";
    display.print("C) Send: "+ r);
    (predicted_class > -1) ? display.drawBitmap((SCREEN_WIDTH-class_widths[predicted_class])/2, 0, class_logos[predicted_class], class_widths[predicted_class], class_heights[predicted_class], SSD1306_WHITE) : display.drawBitmap((SCREEN_WIDTH-l_w)/2, 0, interface_logos[menu_option], l_w, l_h, SSD1306_WHITE);
    display.display();
  }
}
⭐ If the fourth menu option (Run Inference) is activated:
⭐ Display the model inference options on the SSD1306 screen.
⭐ If the control button A is pressed, run an inference with the Edge Impulse neural network model with the Ridge classifier.
⭐ If the neural network model detects an air bubble class successfully, notify the user by showing the associated class icon on the SSD1306 screen.
⭐ After showing the detected class, if the control button C is pressed, transfer the model detection results (ultrasonic scan buffer passed to the model and the detected label) to the web application via an HTTP POST request.
⭐ According to the data transmission success, notify the user by showing the associated connection icon on the screen.
⭐ If the control button D is pressed, redirect the user to the home screen.
  if(!digitalRead(control_button_B) && menu_option == 4){
    selected_interface[menu_option-1] = true;
    adjustColor(255,255,255);
    while(selected_interface[menu_option-1]){
      // Display the running inference progress on the SSD1306 screen.
      show_interface("run", menu_option);
      // If the control button A is pressed, run the Edge Impulse neural network model to detect aquatic air bubbles by applying the ultrasonic scan data points collected via the URM15 ultrasonic sensor.
      if(!digitalRead(control_button_A)){
        // Run inference.
        run_inference_to_make_predictions(true);
        delay(2000);
      }
      // After running the neural network model successfully, if the control button C is pressed, transfer the applied data record (ultrasonic scan buffer) and the detected air bubble class to the web application via an HTTP POST request.
      if(!digitalRead(control_button_C) && predicted_class > -1){
        if(make_a_post_request("?scan=OK&type=detection&class=" + classes[predicted_class])){
          // If successful:
          display.clearDisplay();
          display.drawBitmap((SCREEN_WIDTH-connected_width)/2, (SCREEN_HEIGHT-connected_height)/2, connected_bits, connected_width, connected_height, SSD1306_WHITE);
          display.display();
          adjustColor(0,255,0);
          delay(2000);
          adjustColor(255,255,255);
        }else{
          display.clearDisplay();
          display.drawBitmap((SCREEN_WIDTH-error_width)/2, (SCREEN_HEIGHT-error_height)/2, error_bits, error_width, error_height, SSD1306_WHITE);
          display.display();
          adjustColor(255,0,0);
          delay(2000);
          adjustColor(255,255,255);
        }
      }
      // If the control button D is pressed, redirect the user to the home screen.
      if(!digitalRead(control_button_D)){
        selected_interface[menu_option-1] = false;
        adjustColor(0,0,0);
        // Clear the predicted class (label).
        predicted_class = -1;
      }
    }
  }
Step 28: Running the Neural Network Model to Identify Noxious Air Bubbles


My Edge Impulse neural network model with the Ridge classifier predicts possibilities of labels (air bubble classes) for the passed ultrasonic scan data buffer as an array of 2 numbers. They represent the model's "confidence" that the given features buffer corresponds to each of the two different air bubble classes [0 - 1], as shown in Step 10:
- 0 — bubble
- 1 — normal
You can inspect overlapping user interface features, such as generating an ultrasonic scan buffer in the previous steps.
After setting up and running the optimized neural network model on Nano ESP32:
🐠📡💧📊 As explained in the previous steps, after initiating the ultrasonic image scanning procedure, the device allows the user to generate an ultrasonic scan data buffer — 20 x 20 (400 points).
🐠📡💧📊 If the user activates the fourth menu option — (Run Inference):
🐠📡💧📊 The device turns the RGB LED to white and displays the selectable inference options with their associated buttons.
- A) Run Inference
- C) Send: Pending
🐠📡💧📊 If the control button A is pressed, the device runs an inference with the neural network model to identify noxious underwater air bubbles by utilizing the produced aquatic ultrasonic scan buffer.
🐠📡💧📊 If the neural network model detects an air bubble class successfully, the device notifies the user by showing the associated class icon on the SSD1306 screen.
🐠📡💧📊 After displaying the detected class, if the control button C is pressed, the device transfers the model detection results (ultrasonic scan buffer passed to the model and the detected label) to the web application via an HTTP POST request.
🐠📡💧📊 If Nano ESP32 transfers the given data packet successfully to the web application, the device notifies the user by showing the assigned connection icon on the screen and turning the RGB LED to green.
🐠📡💧📊 Also, Nano ESP32 prints progression notifications on the serial monitor for debugging.
🐠📡💧📊 After receiving the ultrasonic scan data buffer passed to the model, the web application saves the received buffer as a text (TXT) file to the detection folder by adding the detected label and the prediction date to the file name.
- detection_normal__2024_04_03_10_15_35.txt
- detection_bubble__2024_04_03_10_20_52.txt
Step 29: Setting Up the Object Detection Model on UNIHIKER


After building, training, and deploying my RetinaNet object detection model as a Linux (AARCH64) application on Edge Impulse, I needed to upload the generated Linux application to UNIHIKER to run the optimized model directly via the Linux Python SDK so as to create an accessible AI-powered water pollution detection device operating with minimal latency, memory usage, and power consumption.
Since Edge Impulse optimizes and formats signal processing, configuration, and learning blocks into a single EIM file while deploying models as a Linux (AARCH64) application, even for complex computer vision models from NVIDIA TAO, I was able to import my advanced model effortlessly to run inferences in Python.
#️⃣ After downloading the generated Linux (AARCH64) application to the model folder and installing the required modules via SSH, make sure to change the file permissions via the terminal on MobaXterm to be able to execute the model file.
sudo chmod 777 /root/aquarium/model/ai-based-aquatic-chemical-water-quality-testing-linux-aarch64.eim
#️⃣ After switching the SSH connection to the Thonny IDE for programming in Python, create the required folder tree in the root directory of this detection device on UNIHIKER:
- /assets
- /detections
- /model
- /samples
- /scans
- main.py
- _class.py
After uploading the generated Linux application successfully, I programmed UNIHIKER to run inferences via the user interface (GUI) to assess water pollution levels based on the applied chemical water quality tests.
Then, I employed UNIHIKER to transfer the resulting image modified with the produced bounding boxes to a given Telegram bot via the HTTP-based Telegram Bot API.
As mentioned earlier, Nano ESP32 cannot convert the generated ultrasonic scan buffers to ultrasonic images after running the neural network model. Therefore, I employed UNIHIKER to communicate with the web application in order to obtain the latest model detection result (ultrasonic scan buffer passed to the neural network model and the detected air bubble class) and convert the received buffer to an ultrasonic image via the built-in OpenCV functions.
Also, similar to the modified resulting image, UNIHIKER can transfer the produced ultrasonic image to the given Telegram bot so as to inform the user of the latest aquatic ultrasonic scan and the presence of toxic underwater air bubbles.
Since the interconnected features for data collection and running advanced AI models are performed by two separate development boards (UNIHIKER and Nano ESP32), the described code snippets show the different aspects of the same code file. Please refer to the code files below to inspect all interconnected functions in detail.
📁 _class.py
Please refer to the _class.py file to inspect all interconnected functions.
⭐ Include the required modules.
import cv2
import numpy
from edge_impulse_linux.image import ImageImpulseRunner
from unihiker import GUI
from pinpong.board import *
from pinpong.extension.unihiker import *
import os
import requests
import datetime
from time import sleep
⭐ In the __init__ function:
⭐ Initialize the USB high-quality camera feed.
⭐ Define the required variables to establish the connection with the web application — Aquatic_Ultrasonic_Imaging.
⭐ Define the required frame settings.
⭐ Define the required configurations to run the Edge Impulse RetinaNet (NVIDIA TAO) object detection model.
⭐ Determine the required parameters to produce an ultrasonic image (20 x 20) from the received ultrasonic scan buffer.
⭐ Define the required parameters to transfer information to the given Telegram bot — @aquatic_ultrasonic_bot — via the HTTP-based Telegram Bot API.
⭐ Initiate the user interface (Tkinter-based GUI) and the GPIO interface of the microcontroller coprocessor via the integrated Python modules.
    def __init__(self, model_file):
        # Initialize the USB high-quality camera feed.
        self.camera = cv2.VideoCapture(0)
        sleep(2)
        # Define the required variables to establish the connection with the web application — Aquatic_Ultrasonic_Imaging.
        self.web_app = "http://192.168.1.22/Aquatic_Ultrasonic_Imaging/"
        # Define the required variables to configure camera settings.
        self.frame_size_m = (320,320)
        self.frame_size_s = (120,120)
        # Define the required configurations to run the Edge Impulse RetinaNet (NVIDIA TAO) object detection model.
        dir_path = os.path.dirname(os.path.realpath(__file__))
        self.model_file = os.path.join(dir_path, model_file)
        self.class_names = ["sterile", "dangerous", "polluted"]
        self.class_colors = ["green", "yellow", "red"]
        self.bb_colors = {"sterile": (0,255,0), "dangerous": (0,255,255), "polluted": (0,0,255)}
        self.selected_class = -1
        self.detected_class = "Pending"
        # Define the required variables to generate an ultrasonic (radar) image.
        self.u_im = {"w": 20, "h": 20, "offset": 20, "temp_path": "./assets/ultrasonic_temp"}
        # Define the required parameters to transfer information to the given Telegram bot — @aquatic_ultrasonic_bot.
        telegram_bot_token = "<____________>" # e.g., 123456:ABC-DEF1234ghIkl-zyx57W2v1u123ew11
        self.telegram_webhook = "https://api.telegram.org/bot{}".format(telegram_bot_token)
        self.latest_air_label = "..."
        # Initiate the user interface (GUI) on UNIHIKER.
        self.interface = GUI()
        # Initiate the built-in sensor features on UNIHIKER.
        Board().begin()
        # Define the RGB LED pins.
        self.rgb = {"r": Pin(Pin.P4, Pin.OUT), "g": Pin(Pin.P5, Pin.OUT), "b": Pin(Pin.P6, Pin.OUT)}
⭐ In the run_inference function:
⭐ Summarize the Edge Impulse RetinaNet model inference settings and print them on the shell.
⭐ Get the currently captured and modified image frame via the high-quality USB webcam.
⭐ After obtaining the modified frame, resize it (if necessary) and generate features from the obtained frame depending on the provided model settings.
⭐ Run an inference.
⭐ Obtain labels (classes) and bounding box measurements for each detected target object on the passed frame.
⭐ If the Edge Impulse model predicts a class successfully, get the imperative predicted label (class).
⭐ Modify the generated model resulting image with the produced bounding boxes (if any) and save the modified resulting image with the prediction date to the detections folder.
⭐ Then, notify the user of the model detection results on the interactive user interface.
⭐ Also, if configured, transfer the modified resulting image and the detected water pollution level (class) to the given Telegram bot as a push notification.
⭐ Finally, stop the running inference.
    def run_inference(self, notify="Telegram", bb_offset=40):
        # Run inference to detect water quality levels based on chemical water tests via object detection.
        with ImageImpulseRunner(self.model_file) as runner:
            try:
                resulting_image = " "
                # Print the information of the Edge Impulse model converted to a Linux (AARCH64) application (.eim).
                model_info = runner.init()
                print('\nLoaded runner for "' + model_info['project']['owner'] + ' / ' + model_info['project']['name'] + '"')
                labels = model_info['model_parameters']['labels']
                # Get the currently captured and modified image via the high-quality USB webcam.
                test_img = self.modified_image
                # After obtaining the test frame, resize (if necessary) and generate features from the retrieved frame depending on the provided model so as to run an inference.
                features, cropped = runner.get_features_from_image(test_img)
                res = runner.classify(features)
                # Obtain the prediction (detection) results for each label (class).
                if "bounding_boxes" in res["result"].keys():
                    print('Found %d bounding boxes (%d ms.)' % (len(res["result"]["bounding_boxes"]), res['timing']['dsp'] + res['timing']['classification']))
                    # If the Edge Impulse model predicts a class successfully:
                    if(len(res["result"]["bounding_boxes"]) == 0):
                        self.detected_class = "empty"
                    else:
                        for bb in res["result"]["bounding_boxes"]:
                            # Get the latest detected labels:
                            self.detected_class = bb['label']
                            print('\t%s (%.2f): x=%d y=%d w=%d h=%d' % (bb['label'], bb['value'], bb['x'], bb['y'], bb['width'], bb['height']))
                            cv2.rectangle(cropped, (bb['x']-bb_offset, bb['y']-bb_offset), (bb['x']+bb['width']+bb_offset, bb['y']+bb['height']+bb_offset), self.bb_colors[self.detected_class], 2)
                # Save the generated model resulting image with the passed bounding boxes (if any) to the detections folder.
                if self.detected_class != "empty":
                    date = datetime.datetime.now().strftime("%Y%m%d_%H%M%S")
                    resulting_image = "/detections/detection_{}_{}".format(self.detected_class, date)
                    cv2.imwrite("."+resulting_image, cropped)
                # Notify the user of the model detection results on UNIHIKER.
                self.cam_info_text.config(text="Detection: " + self.detected_class)
                print("\n\nLatest Detected Label => " + self.detected_class)
                if(self.detected_class == "sterile"): self.adjust_color([0,1,0])
                if(self.detected_class == "dangerous"): self.adjust_color([1,1,0])
                if(self.detected_class == "polluted"): self.adjust_color([1,0,0])
                sleep(2)
                self.adjust_color([0,1,1])
                # If requested, also inform the user via Telegram by transferring the modified model resulting image and the latest detected water quality class.
                if(notify == "Telegram" and self.detected_class != "empty"):
                    self.telegram_send_data("water_test", "6465514194", resulting_image)
            # Stop the running inference.
            finally:
                if(runner):
                    runner.stop()
⭐ In the make_a_get_request function:
⭐ Depending on the passed command, make an HTTP GET request to the web application in order to perform these tasks:
⭐ Make the web application to generate a CSV file from the stored ultrasonic scan buffer samples (text files).
⭐ Obtain the latest neural network model detection result (ultrasonic scan buffer passed to the neural network model and the detected air bubble class) and convert the retrieved buffer (400 points) to an ultrasonic image (20 x 20).
⭐ Then, display the produced ultrasonic image with the detected air bubble class (label) for further inspection.
    def make_a_get_request(self, com):
        # Depending on the given command, make an HTTP GET request to communicate with the web application.
        if(com == "csv"):
            # If requested, generate a CSV file from the ultrasonic scan information sent by Nano ESP32 — data records.
            req = requests.get(self.web_app + "generate.php?create=csv")
            if(req.status_code == 200):
                if(req.text.find("Server => ") > -1):
                    self.ultra_info_text.config(text="CSV file generated successfully!")
                    self.adjust_color([0,1,1])
                print("\n"+req.text)
            else:
                print("Server => Connection Error: " + str(req.status_code))
        elif(com == "get_model_result"):
            # If requested, get the latest neural network model detection result.
            # Then, convert the retrieved resulting data record to an ultrasonic (radar) image.
            req = requests.get(self.web_app + "generate.php?model_result=OK")
            if(req.status_code == 200):
                data_packet = req.text.split("_")
                self.latest_air_label = data_packet[0]
                data_record = data_packet[1]
                # Generate ultrasonic image.
                self.adjust_color([1,1,0])
                self.generate_ultrasonic_image(data_record)
                # Display the latest generated ultrasonic image with the detected air bubble class (label) for further inspection.
                self.ultrasonic_img.config(image="scans/latest_ultrasonic_image")
                self.ultra_info_text.config(text="Detected Class: " + self.latest_air_label)
            else:
                print("Server => Connection Error: " + str(req.status_code))
⭐ In the generate_ultrasonic_image function:
⭐ Obtain the template image — black square.
⭐ Split the received ultrasonic scan data buffer to obtain each data point individually.
⭐ For each data point, draw depth indicators, color-coded according to the given depth ranges, on the template image via the built-in OpenCV functions.
⭐ After concluding drawing color-coded indicators (20 x 20) on the template, save the modified image as the latest ultrasonic image to the scans folder — latest_ultrasonic_image.
    def generate_ultrasonic_image(self, data_record, scanned_image_path="./scans/latest_ultrasonic_image"):
        x = 0
        y = 0
        # Get template image.
        template = cv2.imread(self.u_im["temp_path"])
        # Obtain the individual data points by decoding the passed data record.
        data_points = data_record.split(",")
        for point in data_points:
            # Draw depth indicators on the image template according to the given data point.
            p = float(point)*100
            if(p >= 15 and p < 20): cv2.rectangle(template, (x,y), (x+self.u_im["w"],y+self.u_im["h"]), (255,255,255), -1)
            if(p >= 20 and p < 25): cv2.rectangle(template, (x,y), (x+self.u_im["w"],y+self.u_im["h"]), (255,255,0), -1)
            if(p >= 25 and p < 30): cv2.rectangle(template, (x,y), (x+self.u_im["w"],y+self.u_im["h"]), (255,0,0), -1)
            if(p >= 30 and p < 35): cv2.rectangle(template, (x,y), (x+self.u_im["w"],y+self.u_im["h"]), (0,255,255), -1)
            if(p >= 35): cv2.rectangle(template, (x,y), (x + self.u_im["w"], y + self.u_im["h"]), (0,255,0), -1)
            # Configure coordinates.
            x += self.u_im["offset"]
            if(x == 400):
                x = 0
                y += self.u_im["offset"]
            print(str(x) + ", " + str(y))
        # Save the generated ultrasonic image.
        cv2.imwrite(scanned_image_path, template)
        print("\nUltrasonic image generated and saved successfully!")
⭐ In the telegram_send_data function:
⭐ Get the directory path of the root folder of this application (aquarium) on UNIHIKER.
⭐ Depending on the passed command (ultrasonic or water_test):
⭐ Make an HTTP POST request to the HTTP-based Telegram Bot API so as to transfer the produced ultrasonic image and the detected air bubble class to the given Telegram bot.
⭐ Make an HTTP POST request to the HTTP-based Telegram Bot API so as to transfer the resulting image modified with the produced bounding boxes and the detected water pollution level to the given Telegram bot.
⭐ After sending an image from the local storage successfully, notify the user via the interactive user interface.
    def telegram_send_data(self, com, chat_id, file_path="/scans/latest_ultrasonic_image"):
        # Get the file directory.
        _dir = os.path.abspath(os.getcwd())
        if(com == "ultrasonic"):
            path = self.telegram_webhook + "/sendPhoto"
            image_path = _dir + file_path
            # Make an HTTP POST request to transfer the generated ultrasonic image to the given Telegram bot via the Telegram Bot API.
            req = requests.post(path, data={"chat_id": chat_id, "caption": "🖼 Ultrasonic Image Received!\n\n📡 Detected Class: "+self.latest_air_label}, files={"photo": open(image_path, 'rb')})
            if(req.status_code == 200):
                self.adjust_color([0,1,0])
                self.ultra_info_text.config(text="Image transferred to the Telegram bot!")
                print("\nImage transferred to the Telegram bot!")
            else:
                print("Server => Connection Error: " + str(req.status_code))
        if(com == "water_test"):
            path = self.telegram_webhook + "/sendPhoto"
            image_path = _dir + file_path
            # Make an HTTP POST request to transfer the model resulting image modified with the passed bounding boxes to the given Telegram bot via the Telegram Bot API.
            req = requests.post(path, data={"chat_id": chat_id, "caption": "🤖 Inference running successfully!\n\n💧 Detected Class: " + self.detected_class}, files={"photo": open(image_path, 'rb')})
            if(req.status_code == 200):
                self.adjust_color([0,1,0])
                self.cam_info_text.config(text="Image[{}] sent to Telegram!".format(self.detected_class))
                print("\nModel resulting image transferred to the Telegram bot!")
                sleep(2)
                self.adjust_color([0,1,1])
            else:
                print("Server => Connection Error: " + str(req.status_code))
📁 main.py
I employed the main.py file to initialize the user interface (GUI), the GPIO interface of the microcontroller coprocessor, and the camera feed simultaneously.
⭐ Define the aquarium object of the aquarium_func class.
⭐ Define and initialize separate Python threads to start the camera feed and the GPIO interface.
⭐ Enable the interactive user interface (GUI) designed with the built-in UNIHIKER modules consecutively.
# Define the aquarium object.
aquarium = aquarium_func("model/ai-based-aquatic-chemical-water-quality-testing-linux-aarch64.eim")

# Define and initialize threads.
Thread(target=aquarium.camera_feed).start()
Thread(target=aquarium.board_configuration).start()

# Show the user interface (GUI) designed with the built-in UNIHIKER modules.
aquarium.create_user_interface()
Step 30: Running the RetinaNet Model to Assess Water Pollution Levels and Inform the User Via Telegram


My Edge Impulse object detection (NVIDIA TAO RetinaNet) model scans a captured image frame and predicts the possibilities of trained labels to recognize a target object on the given picture. The prediction result (score) represents the model's "confidence" that the detected target object corresponds to each of the three different labels (classes) [0 - 2], as shown in Step 11:
- 0 — dangerous
- 1 — polluted
- 2 — sterile
After setting up and running the optimized Edge Impulse object detection (RetinaNet) model on UNIHIKER:
🐠📡💧📊 As mentioned earlier, on the Water Quality Test section, the device lets the user generate a snapshot image to inspect the latest stored camera frame.
🐠📡💧📊 Then, the device waits for the user to decide on the resized camera frame to pass to the object detection model while generating and inspecting multiple snapshot images.
🐠📡💧📊 When the user clicks the Run Inference button, the device runs an inference with the object detection model to detect the water pollution level based on the applied chemical water quality tests.
🐠📡💧📊 After detecting a water pollution level (class) successfully, the device modifies the resulting image with the produced bounding boxes and saves the modified resulting image with the prediction date to the detections folder.
🐠📡💧📊 Then, if configured, the device transfers the latest saved resulting image and the detected class to the given Telegram bot by making an HTTP POST request to the HTTP-based Telegram Bot API.
#️⃣ Since the HTTP-based Telegram Bot API accepts local files, I was able to send images from UNIHIKER local storage to the given Telegram bot without establishing an SSL connection to set a webhook.
🐠📡💧📊 After sending the push notification to the Telegram bot successfully, the device notifies the user via the onboard touchscreen.
🐠📡💧📊 Also, UNIHIKER prints progression notifications on the shell for debugging.
🐠📡💧📊 As mentioned earlier, the device employs the secondary RGB LED to inform the user of the device status while performing operations related to UNIHIKER. Since I was planning to place UNIHIKER on the back of the Squid PCB initially, I configured the micro:bit-compatible edge connector (Kitronik) pin connections reversed. Due to my aquarium's shape, I subsequently decided to position UNIHIKER to the front. Thus, solder the edge connector backward or flip UNIHIKER to enable the secondary RGB LED.
After applying four color-coded water quality tests and conducting diverse experiments, I obtained accurate and consistent prediction results for each water pollution level (class).
Step 31: Producing Aquatic Ultrasonic Images From Buffers to Visualize Harmful Air Bubbles


As mentioned repeatedly, Nano ESP32 cannot convert the produced ultrasonic scan buffers to ultrasonic images after running the neural network model. Thus, I provided additional features via the UNIHIKER user interface (GUI) so as to enable UNIHIKER to access the neural network model results via the web application.
🐠📡💧📊 If the user clicks the Aquatic Ultrasonic Scan button, the device opens the Aquatic Ultrasonic Scan section.
🐠📡💧📊 If the user clicks the Generate CSV button, the device makes an HTTP GET request to the web application, forcing the application to generate a pre-formatted CSV file (scan_data_items.csv) from all of the stored ultrasonic scan buffer samples (text files).
🐠📡💧📊 If the user clicks the Generate Image button:
🐠📡💧📊 The device makes an HTTP GET request to the web application so as to obtain the latest neural network model detection results, including the ultrasonic scan buffer passed to the neural network model and the detected air bubble class (label).
🐠📡💧📊 Then, the device splits the retrieved ultrasonic scan data buffer to obtain each data point individually.
🐠📡💧📊 The device draws depth indicators (20 x 20) on the passed template image (black square) via the built-in OpenCV functions.
🐠📡💧📊 While generating the aquatic ultrasonic image (20 x 20) from 400 data points, the device assigns colors to depth indicators according to the predefined depth ranges so as to visualize the given aquatic ultrasonic scan with thoroughly encoded pixels.
🐠📡💧📊 Since OpenCV functions are optimized for the BGR format, the color tuples should be passed accordingly.
- 15 <= p < 20 ➡ (255,255,255)
- 20 <= p < 25 ➡ (255,255,0)
- 5 <= p < 30 ➡ (255,0,0)
- 30 <= p < 35 ➡ (0,255,255)
- p >= 35 ➡ (0,255,0)
🐠📡💧📊 After producing the aquatic ultrasonic image, the device saves the generated image to the scans folder — latest_ultrasonic_image.
🐠📡💧📊 Then, the device shows the latest aquatic ultrasonic image with the detected air bubble class (label) on the user interface (GUI) for further inspection.
🐠📡💧📊 If the user clicks the displayed aquatic ultrasonic image on the onboard touchscreen, the device transfers the aquatic ultrasonic image and the detected air bubble class to the given Telegram bot by making an HTTP POST request to the HTTP-based Telegram Bot API.
🐠📡💧📊 After sending the push notification to the Telegram bot successfully, the device notifies the user via the onboard touchscreen.
After conducting numerous experiments, UNIHIKER kept producing precise aquatic ultrasonic images to visualize aquatic ultrasonic scans manifesting noxious underwater air bubbles and inform the user via Telegram push notifications.
Step 32: Videos and Conclusion
Step 33: Further Discussions

By applying advanced AI-powered multi-algorithm detection methods to identify toxic underwater air bubbles and assess water pollution based on chemical water quality tests, we can achieve to:
🐠📡💧📊 employ ultrasonic imaging as a nondestructive inspection method to identify air gaps and assess water pollution consecutively to find any underlying conditions of accumulating harmful underwater waste,
🐠📡💧📊 prevent contaminants from impinging on aquatic life,
🐠📡💧📊 avert algal blooms, hypoxia (dead zones), and expanding barren lands,
🐠📡💧📊 detect the surge of toxic air bubbles to preclude potential environmental hazards,
🐠📡💧📊 assist commercial aquaculture facilities in protecting aquatic life acclimatized to the enclosed water bodies,
🐠📡💧📊 help retail fish farms increase their profit and survival rates.
Step 34: References
[1]Ocean pollution and marine debris, National Oceanic and Atmospheric Administration, https://www.noaa.gov/education/resource-collections/ocean-coasts/ocean-pollution.
[2] Engler, Richard. (2012). The Complex Interaction between Marine Debris and Toxic Chemicals in the Ocean. Environmental science & technology. https://www.researchgate.net/publication/232609179_The_Complex_Interaction_between_Marine_Debris_and_Toxic_Chemicals_in_the_Ocean.
Step 35: Schematics


Step 36: Code and Downloads

This is an entry in the
Made with AI - Autodesk Design & Make - Student Contest

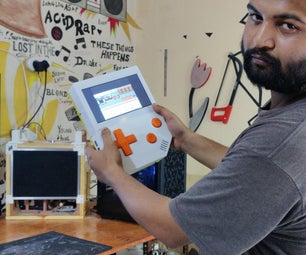
![Tim's Mechanical Spider Leg [LU9685-20CU]](https://content.instructables.com/FFB/5R4I/LVKZ6G6R/FFB5R4ILVKZ6G6R.png?auto=webp&crop=1.2%3A1&frame=1&width=306)


