

Introduction: Making Art, Games, and More With Pi and Python


Celebrate Pi Day by making art, music, games with Pi using Python. In this Google Colaboratory Notebook, you will explore what Pi is, how it's used, and some fun applications. Open the Colab Notebook and follow along!
Google Colaboratory Notebook: https://colab.research.google.com/drive/1scICArIp5mQC5EQkT4FtnQ9-qtw4ECzc?usp=sharing
GitHub Repository: https://github.com/mjdargen/pi/
Table of Contents - Making Art, Games, and More with Pi and Python
- Install Dependencies and Download Files
- What is π?
- How old are you in terms of π?
- Approximating π
- One Million Digits of π
- Plot Distribution of the Digits of π
- π Chord Diagram
- Snake - Pi Version
- Binary Pixel Image of π
- Making Music with π
- Art with π & Processing
- Using π to find Kevin Bacon
Step 1: Colab & Setting Up Environment

Intro to Colab
Google Colaboratory is a Python development environment using Jupyter Notebooks that allows you to connect to Google’s powerful cloud computing resources and run Python code. It allows you to maintain a runtime environment where you can install packages, access data online, navigate a file system, and store/reuse data.
Google Colaboratory Notebook: https://colab.research.google.com/drive/1scICArIp5mQC5EQkT4FtnQ9-qtw4ECzc?usp=sharing
Executing Code in Colab
There are two different types of cells: code & text. Text cells are used to describe what's going on. Code cells can be executed one at a time by clicking the play button. The Colab notebook is broken up into 12 different sections. To run the code in a particular cell, click the play button to the top-left of the code cell.
Note: There is also a Jupyter Notebook in the GitHub repository that you can use.
Install Dependencies and Download Files
In the first section, we will install all of the dependencies and clone my GitHub repository to gain access to the helper code and the text files containing the digits of pi. You must run this cell first before running any other cell. It downloads various dependencies into the Linux environment and installs various python packages needed to run the code later on.
Step 2: What Is Pi?
Pi (π) is an irrational number. An irrational number means that the number cannot be represented as a common fraction and that its decimal representation goes on forever and never settles on a repeating pattern. That means we do not know, nor will we ever know the true value of pi.
Pi is also a transcendental number which means it is a number that is not the root of a non-zero polynomial with rational coefficients. This essentially means that the number is non-algebraic. The best known transcendental numbers are π and e.
Determining a value for pi has been a competitive game that has stretched on for ages as described in this timeline. To date, Timothy Mullican currently holds the record for computing 50 trillion digits of pi which took 303 days using an algorithm called "y-cruncher" developed by Alexander Yee.
Despite not knowing the true value of pi, it is still a very important number that we use daily. It is defined as the ratio of a circle's circumference to its diameter; however, its uses extend far behind basic geometry. You can watch this (relatively older) Numberphile video diving into pi in more detail.
Pi is the most infamous number. It is the only number with a widely-recognized holiday - Pi Day on March 14th. In this notebook, we will explore various aspects of pi and try to have some fun with the number.
Step 3: How Old Are You in Terms of Pi?

Compute how old you are in terms of pi. Input your birthday in the fields specified to determine your age in pi-years and pi-days.
Step 4: Approximating Pi
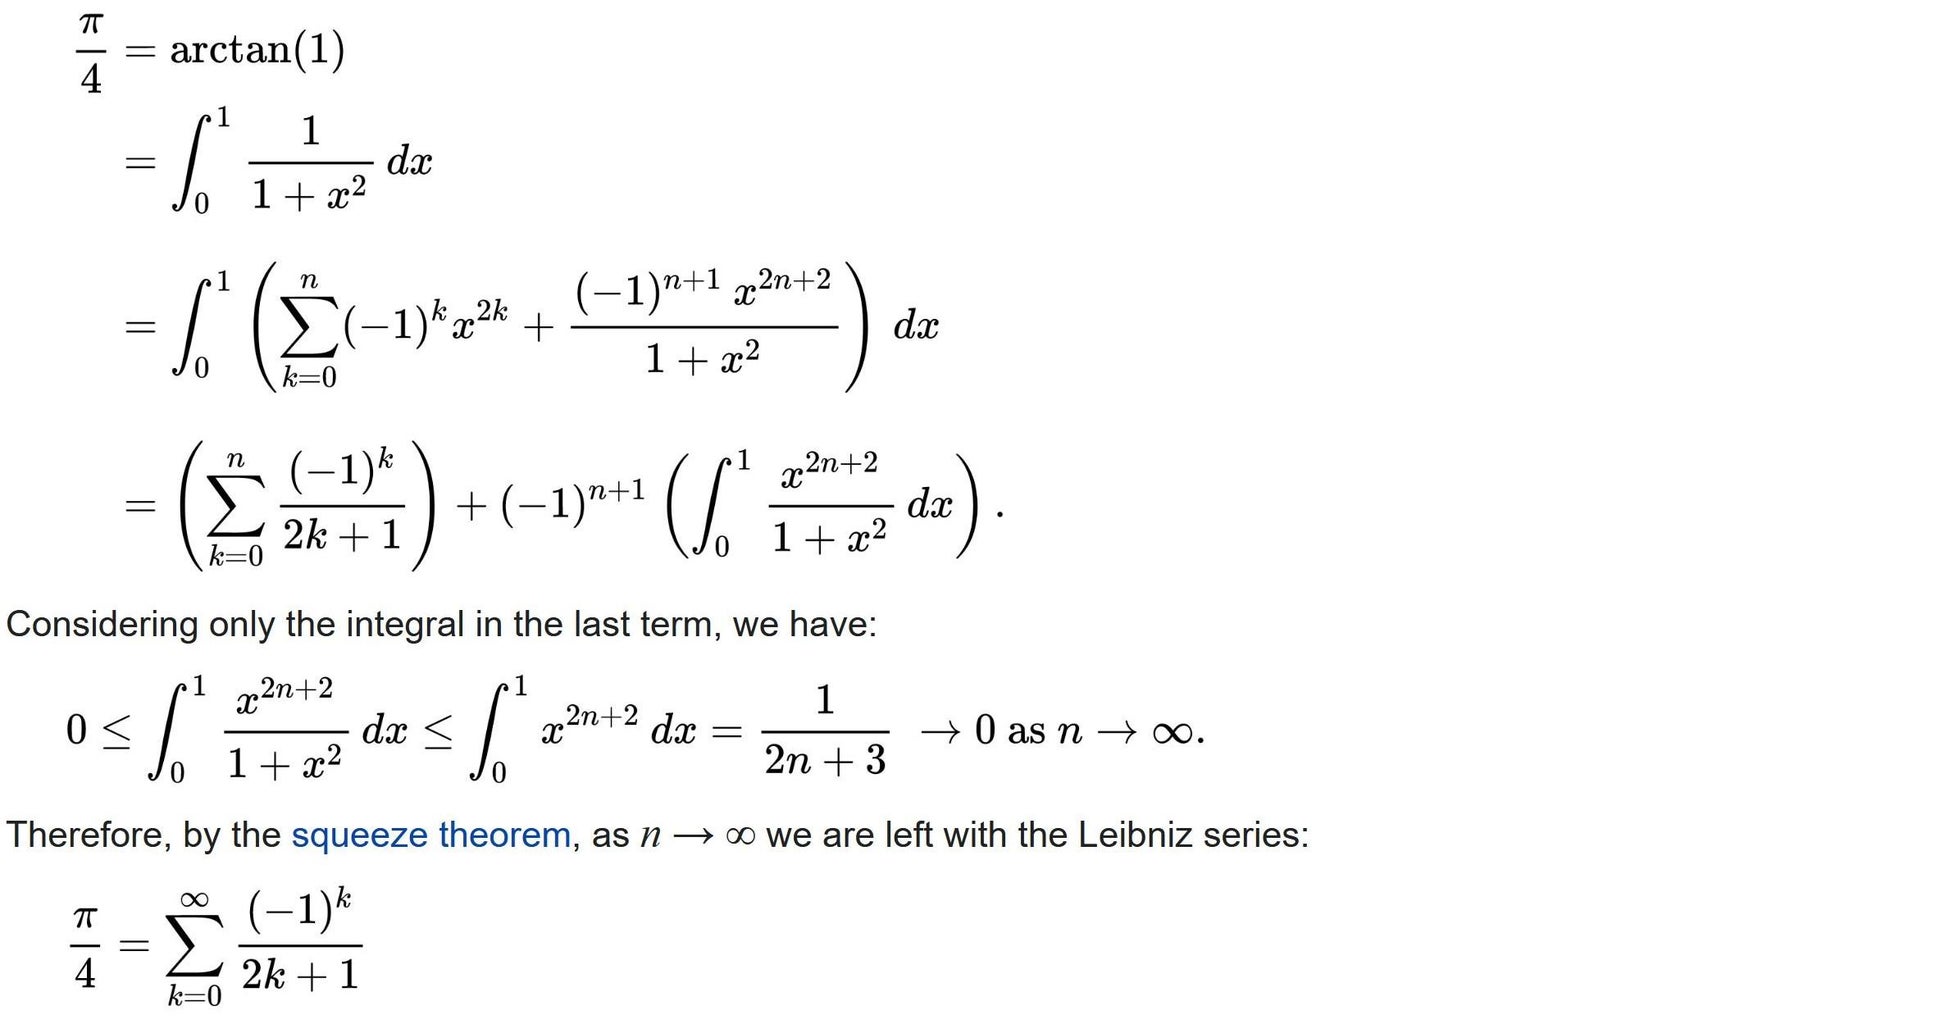
Approximate pi using a specified number of summation terms. We will be using the Leibniz formula for approximating π. It is an infinite alternating series that slowly converges towards pi as described by the formula below.
To use the program, specify how many terms (n) you would like to use to approximate pi. The program will spit out the resulting approximation.
Step 5: One Million Digits of Pi
View the first one million decimal digits of pi and the first one million hexadecimal digits of pi. After running the cells below, click the 'x' near the output window to clear the cell. Displaying millions of characters can burden your browser and slowdown the notebook.
One Million Decimal Digits of Pi: https://raw.githubusercontent.com/mjdargen/pi/main/pi_dec_1m.txt
One Million Hexadecimal Digits of Pi: https://raw.githubusercontent.com/mjdargen/pi/main/pi_hex_1m.txt
Step 6: Plot Distribution of the Digits of Pi


In this section, we are going to further inspect the first one million decimal and hexadecimal digits of pi. We will plot the distribution of the digits of pi to figure out if there are digits that occur more in the first one million digits of pi.
The first plot will be the decimal digits of pi and the second plot will be the hexadecimal digits of pi. The diagrams are also written to the "output" folder as an interactive .html webpage that can be downloaded in the file tab on the left in Colab. These plots are generated using a Plotly bar plot.
Step 7: Pi Chord Diagram


A chord diagram is a special type of diagram that shoes edges or arcs from nodes on a circular plot. In this case, we are showing the progression of the digits of pi. The nodes represent each possible value of a digit (0-9 for decimal and 0-15 for hexadecimal). The arcs or edges represent transitions from one digit to the next. For example, the first digits after the decimal point for pi are "14159". We would start at 1 and draw an arc to 4, then draw an arc from 4 to 1, then an arc from 1 to 5, then an arc from 5 to 9, and so on.
The first diagram shows the chord diagram for the first one million decimal digits of pi. The second diagram shows the chord diagram for the first one million hexadecimal digits of pi. The diagrams are also written to the "output" folder as an interactive .html webpage that can be downloaded in the file tab on the left in Colab. The chord diagrams are generated with the chord module.
Step 8: Snake - Pi Version

Play the Pi version of Snake! I modified Snake so the snake appears as various segments of π. Instead of eating food, the snake is trying to eat the decimal digits of pi in sequential order. See how many digits of pi you can eat!
Note: This code won't run properly in Google Colab, so I had to embed my repl.it project. View the source code here. This project was originally forked from @LorenzoCampos and tweaked to make the pi version. See and play the game below.
Step 9: Binary Pixel Image of Pi

Pi can also be represented as a binary number. In order to do this, I take the first million hexadecimal digits and convert it to a binary number byte by byte. To visualize this information, I will represent the first 1 million hexadecimal digits as a 2000x2000 monochrome black/white image. The zeros are represented by a black pixel and the ones are represented as a white pixel.
See the full image in this section. It may appear as a solid white image for a minute as the image will take a little while to load in the Colab output window. The image is also saved in the "output" window and can be downloaded in the file tab on the left in Colab. The script uses the Pillow module to generate the image.
Step 10: Making Music With Pi
We can even make music with pi. The script below uses numpy to compute the waveforms and scipy to write to a .wav file. I kept some of the code in piaudio.py to keep from cluttering the notebook. This file is responsible for mapping the string note representations to specific frequencies and constructing the selected waveform for each note based on the duration and the BPM.
Try playing along with the notes dictionary to see what sort of cool sounds you can make with pi. Map certain digit values to keys on the keyboard. Must write the notes in the following format shown below. You can also specify what type of waveform you want by supplying the waveform argument to the play_note() function. It can either be sinusoid, triangle, sawtooth, or square.
Determine whether you want to use the decimal digits or the hexadecimal digits of pi by using either line 20 or line 22. By default, the script below only uses the first 100 digits of pi. Using the full one million digits of pi would take way too long to execute.
A play window will show up in the output window to preview the audio. You can also download the .wav file. The audio is also saved in the "output" window and can be downloaded in the file tab on the left.
Note format explained:
- Must start with: NOTE_
- First letter is the note: A-G
- If there is an "S", means sharp (no flats)
- Number is octave on the keyboard, 0-lowest, 8-highest
Step 11: Art With Pi & Processing

Processing is a flexible software sketchbook and a language for learning how to code within the context of the visual arts. It is a free graphical library and IDE. It is built in Java; however, there is also a Python mode.
You can't run Processing code in Google Colaboratory. You will need to download Processing and install the Python Mode add-on. Follow this Getting Started guide.
This Processing script parses the first 10,000 decimal digits of pi and represents them as circles. The color of the circles indicates the numerical value of that digit.
See the graphic generated below. You can also download the graphic here. I provide the code to generate the graphic below. You can also view/download the script from my GitHub repo here.
Step 12: Using Pi to Find Kevin Bacon
This script shows how we can essentially use the digits of pi as a pseudo-random number generator for an algorithm.
Below we are going to explore the Six Degrees of Kevin Bacon using pi. Six Degrees of Kevin Bacon is a game / thought experiment that is an example of "six degrees of separation". The idea behind "six degrees of separation" is that any two people are (on average) six or fewer social connections away from each other. As a dumb way to explore this, we will load a random Wikipedia page and follow the links on that page until we arrive on Kevin Bacon's Wikipedia page.
We use the random Wikipedia page as our starting point. From there, the script gets a list of all valid Wikipedia pages linked on a single page. Then the script uses the hexadecimal digits of pi in sequential order to determine which one of the Wikipedia pages we visit next.
The script below can take a long time to execute depending upon how many pages it needs to visit until we find Kevin Bacon's Wikipedia page. The minimal number of pages I've needed to visit so far has been 2,254 pages.
Step 13: More Projects
For more projects, visit these links:

Participated in the
Pi Day Speed Challenge


![Tim's Mechanical Spider Leg [LU9685-20CU]](https://content.instructables.com/FFB/5R4I/LVKZ6G6R/FFB5R4ILVKZ6G6R.png?auto=webp&crop=1.2%3A1&frame=1&width=306)


