

Introduction: LIDAR With Custom ThreeJS Graphics


Full scanning LIDAR (Light Detection and Ranging) with graphics from threejs.
Supplies

Parts:
- LIDAR - Garmin LIDAR-Lite Optical Distance Sensor - V3
- Microchip - Adafruit Feather M4 Express
- Motor shield - DC Motor + Stepper FeatherWing
- Stepper motor - NEMA 17.
- Slip ring - With ~8mm diameter rotating plastic tube.
- 8mm bore pulley with 60 teeth - Importantly it's 8mm bore (inside diameter of the center hole). In this project, a pulley with 60 teeth keeps the belt tight. If you use different sized mounts or pulleys, some pieces may not fit! Trying to be frugal, I also used the two extra pulleys for a counterweight.
- 5mm bore pulley with 20 teeth and with 200mm Width 6mm Belt - 5mm bore is important, comes with a belt.
- Pan tilt servo mount - Used three of the four mounts. Small bearings were used in the aluminum counterweight.
- Servo motor MG995 - Comes with the LIDAR attachment.
- Stepper motor mount - NEMA 17 42 Series, dimensions are important to keep belt tight. Used three of five.
Extra Parts:
- epoxy glue
- DC power supply
- zip ties
- 680uF capacitor
- legos
- screws
- groove cable
- large piece of tungsten (it's heavy!)
Like the tungsten counterweight, some of this can be done differently. This stepper motor needs a 12 volt supply that does not exceed 350mA. This could be a potential power supply for the stepper motor. In this setup, the stepper motor never exceeded 350mA. Research if you plan on powering the stepper motor w/o a controlled DC power source.
Step 1: Hardware


I'm a fan of https://www.adafruit.com/ but many other chips would work.
Circuit
For the Feather M4 Express and the Stepper FeatherWing (motor shield), connect the SDA, SCL, 3 Volt, Ground pins, and that's it! The two feather boards pins align as if you stacked them vertically. The NEMA 17 stepper motor will have its own dedicated 12 volt DC power. The LIDAR and stepper motor will share the 5 volts from the feather's USB pin. A 680uF capacitor will be connected to the 5 volts and ground. Short leg of the capacitor to ground. The LIDAR will share the SCL and SDA pins with the motor shield for communication. The servo motor will use the Feather's A2 pin.
Mechanics
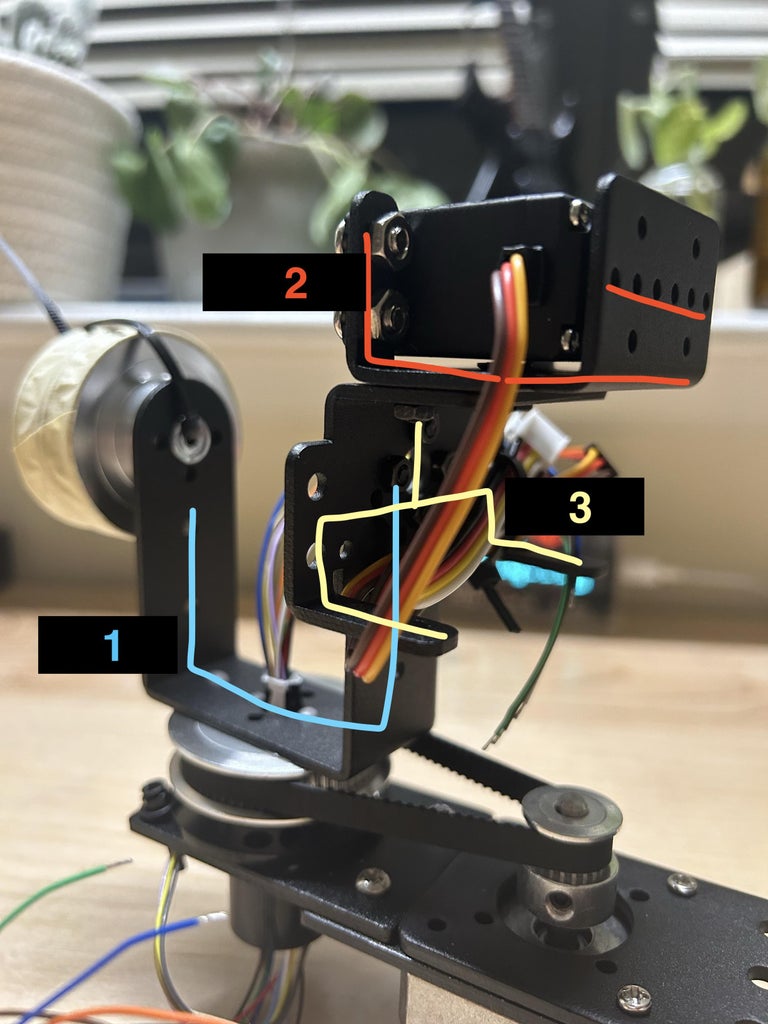
A system that pans 360 degrees and tilts 90 degrees will cover at least half a room. The slip ring is a crucial component as it will be the axis of pan rotation. 7 of the 12 slip ring wires are used. 4 wires for the LIDAR, 3 for the servo. The LIDAR tilts directly above the pan rotation point to get as close to spherical units as possible.
- A few times I got lucky and things happened to fit together, a few times I had to get creative.
- For the servo mount, I did not follow the intended build and I used three of the four mounts from Pan tilt servo mount. Please see the pictures.
- I used a small piece of paper around the plastic part of the slip ring to make a tighter connection.
- The aluminum counterweight uses two bearings from the amazon servo-pan-tilt with a zip tie.
Check adafruit's tutorials, like stepper motor with the motor shield. I was using a different method (in code) to step the motor and pulled too much current. My motor stopped working for about 20 minutes because it was so hot! This project uses sensitive DC motors and expensive sensors. Be careful.
Pulley logic is straight forward. The NEMA 17 stepper takes 200 steps for a full rotation. Using a 20 to 60 teeth ratio will cause our pulley with 60 teeth (LIDAR pan) to have 600 steps per revolution (200 * 60/20 = 600). This will be seen in the C++ for loop.
Testing
Test the motors and pieces as you go using the excellent guides adafruit provides. For example, if the shield is wired correctly, a green light will turn on :)
Step 2: Final Hardware Set Up


I wanted this device to be as straightforward as possible. Unfortunately, I had to start digging in my closet for parts. I'm sure a lot of this can be done with your own custom parts, with better design.
For example, the LIDAR (the most expensive part!) is attached w/ two screws, a lego, and epoxy. ¯\_(ツ)_/¯. It uses a servo attachment that comes with the MG995 servo. 4 of the 6 Lidar wires are used, see picture.
5volt, ground, signal pin from the servo and the 5 volt, ground, SCL, SDA from the LIDAR attach to the slip ring wires. I used a groove cable to attach the LIDAR wires.
Since it can pan 360 degrees, the initial pan angle does not matter. The initial servo angle does matter because it sweeps 0 to 90 degrees, so any offset will cause it to sweep offset to 90+offset. In other words, you want the servo and attached lidar to always start at 90 degrees tilt. This is achieved by setting the servo to 90 with code and physically hooking up the lidar so it is looking parallel to your horizon.
Step 3: Backend Code and Theory


The Adruino code will log the angles (pan and tilt) and distance[cm]. Libraries Adafruit_MotorShield and LIDARLite are found in the library manager. In graphics, it's typical to use the y axis as "up". The angles to xyz conversion are:
- y = r*cos(tilt). dark blue
- z = r*sin(tilt)*cos(pan). dark green
- x r*sin(tilt)*sin(pan). dark yellow
Arduino
#include <Adafruit_MotorShield.h>
Adafruit_MotorShield AFMS = Adafruit_MotorShield();
Adafruit_StepperMotor *myMotor = AFMS.getStepper(200, 2);
#include <Servo.h>
Servo myservo; // brown-->Grnd, orange-->A2
#include <Wire.h>
#include <LIDARLite.h>
LIDARLite myLidarLite;  // blue-->SDA, green-->SCL


// constants that take 0<>180 or 0<>600 to 0<>pi and 0<>2pi
const double dPan = 0.010472;  // dPan * 600 * 180/pi = 360
const double dTilt = 0.017453; // dTilt * 180 * 180/pi = 180


void setup() {
  Serial.begin(9600);
  while (!Serial);
  if (!AFMS.begin()) {
    while (1);
  }
  myMotor->setSpeed(2000);
  myservo.attach(16); // on the Feather, 16 is A2
  myservo.write(0); //servo is backwards from logic, 0 means 90
  myLidarLite.begin(0, true);
  myLidarLite.configure(4);
  delay(6000); // six seconds to move your fingers
}


void loop() {
  for (int tiltDown = 0; tiltDown <= 90; tiltDown += 1) { // goes from 0 degrees to 90 degrees
  // servo was set up backwards so use 90-tiltDown, python data assumes 90 degree servo is the horizon
    for(int pan = 0;pan<600;pan+=1)
    {
      myMotor->step(1, FORWARD, SINGLE); // 600 steps for full turn 20/60 teeth setup, 200 * 60/20 ; INTERLEAVE --> 1200, 400 full full turn
      delay(2);
      Serial.print(dTilt*(90-tiltDown),6);
      Serial.print("-");
      Serial.print(dPan*pan,6);
      Serial.print("-");
      Serial.println(myLidarLite.distance());
    }
    myservo.write(tiltDown);
  }
}
Python
This web socket library from flask sock import Sock might need a pip install.
In less than 100 lines, Python will host the site, take the incoming LIDAR data, convert it to xyz, apply a color map, get the rgb values, and add a size factor so that closer points appear bigger - Python can really be the best sometimes!
from flask import Flask, render_template
import json
from flask_sock import Sock
import numpy as np
from matplotlib import colors, colormaps, cm

import serial

arduino_port = "/dev/cu.usbmodem101"  # serial port of Arduino, go to tools-->port
baud = 9600  # your baud rate
ser = serial.Serial(arduino_port, baud)
print("Connected to Arduino port:" + arduino_port)

app = Flask(__name__)
sock = Sock(app)


class DataIncoming:
    """
    handles incoming serial date
    """

    def __init__(self):
        self.x = 0
        self.y = 0
        self.z = 0
        self.xyz = [0, 0, 0]

    def update(self, phi: float, theta: float, r: int):
        sinPhi = r * np.sin(phi)
        self.y = r * np.cos(phi)
        self.z = sinPhi * np.cos(theta)
        self.x = sinPhi * np.sin(theta)
        self.xyz[0] = self.x
        self.xyz[1] = self.y
        self.xyz[2] = self.z


di = DataIncoming()

# assuming the max distance will be 500 cm and min distance will be 5cm
norm = colors.Normalize(vmin=5, vmax=500)
f2rgb = cm.ScalarMappable(norm=norm, cmap=colormaps['plasma'])


class IDX:
    """
    keeps track of completion
    """

    def __init__(self, size):
        self.size = size
        self.idx = 0

    def update(self, val=1):
        self.idx += val
        self.idx = self.idx % self.size


counter = IDX(54000)  # 600 * 90
cInv = 100 / 54000


@app.route("/")
def index():
    return render_template("index_bloom.html")


# @app.route("/")
# def index():
#     return render_template("index.html")


@sock.route('/echo')
def echo(sock):
    while True:
        try:
            lidarData = ser.readline()
            lidarDataSplit = lidarData.decode('utf-8')[0:-1].split('-')
            distance = int(lidarDataSplit[2])
            di.update(float(lidarDataSplit[0]), -float(lidarDataSplit[1]), distance)
            data = {
                'xyz': di.xyz,
                'rgb': f2rgb.to_rgba(distance)[:3],
                'size': (distance - 5) / 495 + 1  # ~normalized from 1<>2
            }
            print(f"running...: {counter.idx * cInv:.2f}%, distance: {distance}")
            sock.send(json.dumps(data))
            counter.update()
        except Exception as e:
            print("error: ", e)
            counter.update()
            pass


if __name__ == "__main__":
    app.run()
Issues specific to the feather board :|
Issue 1
#include <Wire.h>
#include <LIDARLite.h>
these two lines were not compiling, you need to add:
#define LEGACY_I2C
to both LIDARLite_v3HP.cpp and LIDARLite_v4LED.cpp in the Garmin LIDAR library.
solution found here: https://github.com/garmin/LIDARLite_Arduino_Library/issues/24
Issue 2
#include <Servo.h>
Servo.h was not not compiling. Adafruit has a branch that works.
- Delete your Servo library in your arduino folder
- click this link to download the branch that works, https://github.com/adafruit/Servo/archive/adafruit_samd51.zip
- Rename the unzipped folder from to Servo.zip
- (In the Arduino IDE) Sketch > Include Library > Add .ZIP Library
Why use a chip that has potentially more issues? This is a powerful newer chip that I wanted some practice with. If you use a typical Arduino board, like the uno, it probably will work great and compile code easier.
Step 4: Graphics Code


project GitHub: https://github.com/chrismars91/LIDAR_threejs
I won't go into detail about how to set up a local flask site. In summary, you need a template folder and a static folder. The template folder will have your html and Javascript. Your static folder will have threejs and other graphics libraries like mouse controls.
Run web.py and go to local host like: http://127.0.0.1:5000. The animation should start!
The 3D points
threejs points are used since points will be highly efficient. As always, there is a lot of Javascript. threejs is doing a lot of stuff behind the scenes with WebGL but you have to do some work. Here is a custom class that will create N points ready for rendering. The number of points needed will be 600*90 or 54,000. threejs points can be customized even further by using the onBeforeComplie function. This will give more control on your GPU and consequently the colors, sizes, and visibility. This provided class will allow:
- drawing a new point by index with setPosIdx. Say our 500th LIDAR data point is at x = 15cm, y = 300cm, z = 40 cm, then call LIDARPoints.setPosIdx(500,15,300,40) and the point will show.
- change the color by index with setColorIdx.
- change the size by index with setSizeIdx.
class LIDARPoints extends Points {
    constructor( N, sprite = null )
    {
        const colors = [];const vertices = [];const visibility = [];const sizes = [];
        for (let i = 0; i < N; i++)
        {
            vertices.push( 0, 0, 0);
            colors.push(0.2298057 , 0.29871797, 0.75368315);
            visibility.push(0);
            sizes.push(1);
        }
        const geometry = new BufferGeometry();
        geometry.setAttribute( 'position', new Float32BufferAttribute( vertices, 3 ) );
        geometry.setAttribute( 'color', new Float32BufferAttribute( colors, 3 ) );
        const material = new PointsMaterial({
            map : sprite ,
            size: 2.0,
            blending: AdditiveBlending,
            vertexColors: true,
            transparent: true,
            depthWrite: false,
            onBeforeCompile: function(shader){
                shader.vertexShader = `
                attribute float sizes;
                attribute float visibility;
                varying float vVisible;
                ${shader.vertexShader}`
                .replace(
                    `gl_PointSize = size;`,
                    `gl_PointSize = size * sizes;
                    vVisible = visibility;
                    `
                );
                shader.fragmentShader = `
                varying float vVisible;
                ${shader.fragmentShader}`
                .replace(
                    `#include <clipping_planes_fragment>`,
                    `
                    if (vVisible < 0.5) discard;
                    #include <clipping_planes_fragment>`
                )
            }
        });
        super( geometry, material );
        this.geo = geometry;
        this.positionAttribute = this.geo.getAttribute( 'position' );
        // this.positionAttribute.needsUpdate = true;
        this.posArray = this.positionAttribute.array;
        this.colorAttribute = this.geo.getAttribute( 'color' );
        this.colorArray = this.colorAttribute.array;
        // this.colorAttribute.needsUpdate = true;
        // from shader code
        this.geo.setAttribute("visibility", new Float32BufferAttribute(visibility, 1));
        this.visibilityAttribute = this.geo.getAttribute( 'visibility' );
        this.visibilityArray = this.visibilityAttribute.array;
        // this.visibilityAttribute.needsUpdate = true;
        this.geo.setAttribute("sizes", new Float32BufferAttribute(sizes, 1));
        this.sizeAttribute = this.geo.getAttribute( 'sizes' );
        // this.sizeAttribute.needsUpdate = true;
        this.sizeArray = this.sizeAttribute.array;
        //
        this.renderOrder = 1;
    }
    posUpdate() {this.positionAttribute.needsUpdate = true;}
    colorUpdate() {this.colorAttribute.needsUpdate = true;}
    sizeUpdate() {this.sizeAttribute.needsUpdate = true;}
    visUpdate() {this.visibilityAttribute.needsUpdate = true;}
    setPosIdx( idx, px, py, pz )
    {
        this.posArray[idx*3  ] = px;
        this.posArray[idx*3+1] = py;
        this.posArray[idx*3+2] = pz;
        this.visibilityArray[idx] = 1;
        this.positionAttribute.needsUpdate = true;
        this.visibilityAttribute.needsUpdate = true;
    }
    setColorIdx( idx, cx, cy, cz )
    {
        this.colorArray[idx*3  ] = cx;
        this.colorArray[idx*3+1] = cy;
        this.colorArray[idx*3+2] = cz;
        this.colorAttribute.needsUpdate = true;
    }
    setSizeIdx( idx, s )
    {
        this.sizeArray[idx ] = s;
        this.sizeAttribute.needsUpdate = true;
    }
}
The WebSocket
get the python data and update the graphics
var IDX = 0;
const socket = new WebSocket('ws://' + location.host + '/echo');
socket.addEventListener('message', ev => {
    const pyData = JSON.parse(ev.data);
    const xyz = pyData.xyz;
    const rgb = pyData.rgb;
    points.setPosIdx(IDX,xyz[0],xyz[1],xyz[2]);
    points.setColorIdx(IDX,rgb[0],rgb[1],rgb[2]);
    points.setSizeIdx(IDX,pyData.size);
    IDX += 1;
    IDX = IDX%54000; // hardcoded number
    rVector.setLineOrigin(xyz[0],xyz[1],xyz[2]);
});
The Laser Line
Similar to points, a custom class is used for the line. The line should point to the new incoming data. setLineOrigin will keep the line at the origin and point to the new xyz.
class LaserR  extends Line {
    constructor( ) {
        super();
        const geom = new BufferGeometry();
        geom.setAttribute( 'position', new BufferAttribute( new Float32Array( 2  * 3 ), 3 ) );
        const mat = new LineBasicMaterial( { color: 0x990000 } );
        this.geometry = geom;
        this.material = mat;
        this.positions = this.geometry.attributes.position.array;
        this.positions.frustumCulled = false;
    }
    setLineOrigin( rx,ry,rz ) {
        this.positions[0]=0;
        this.positions[1]=0;
        this.positions[2]=0;
        this.positions[3]=rx;
        this.positions[4]=ry;
        this.positions[5]=rz;
        this.geometry.attributes.position.needsUpdate = true;
        this.computeLineDistances();
    }
}
I'm using a bloom effect for the glow but that is not necessary. I will attach a not bloom version and bloom version. Please note that this is using python flask, so you need the correct JS files in static, project set up, etc.
That's really it! The motors, sensor, and graphics should hum along nicely. It takes my build less than five minutes to gather the 54,000 data points!
