Introduction: Real-time Graphing With the Raspberry Pi


Time for some Raspberry Pi + Plotly Streaming fun!
Recently we completed an Instructable for visualizing temperature and humidity data using an Arduino and Plot.ly, a free online collaborative graphing tool. Now it's time to extend that fun to all Raspberry Pi users!
The Raspberry Pi is a fantastic platform for software experimentation, allowing kids, amateurs and professionals alike to hack away without fear of breaking an expensive computer system. I'm a huge fan, and have done a few projects with my Raspberry Pi, from setting up a web server in our workshop, to using it as a desktop PC when my laptop was in the shop.
Raspberry Pi fun isn't limited only to software activities though! In addition to its other great features, the Raspberry Pi has some GPIO (General Purpose IN/OUT) pins, which you can use to read data from!
The purpose of this Instructable is to take some temperature data read from a TMP36 sensor, and visualize it using real-time streaming using the Plotly Python API!
Here is an example of our final product: https://plot.ly/~demos/1415/
Step 1: What You'll Need
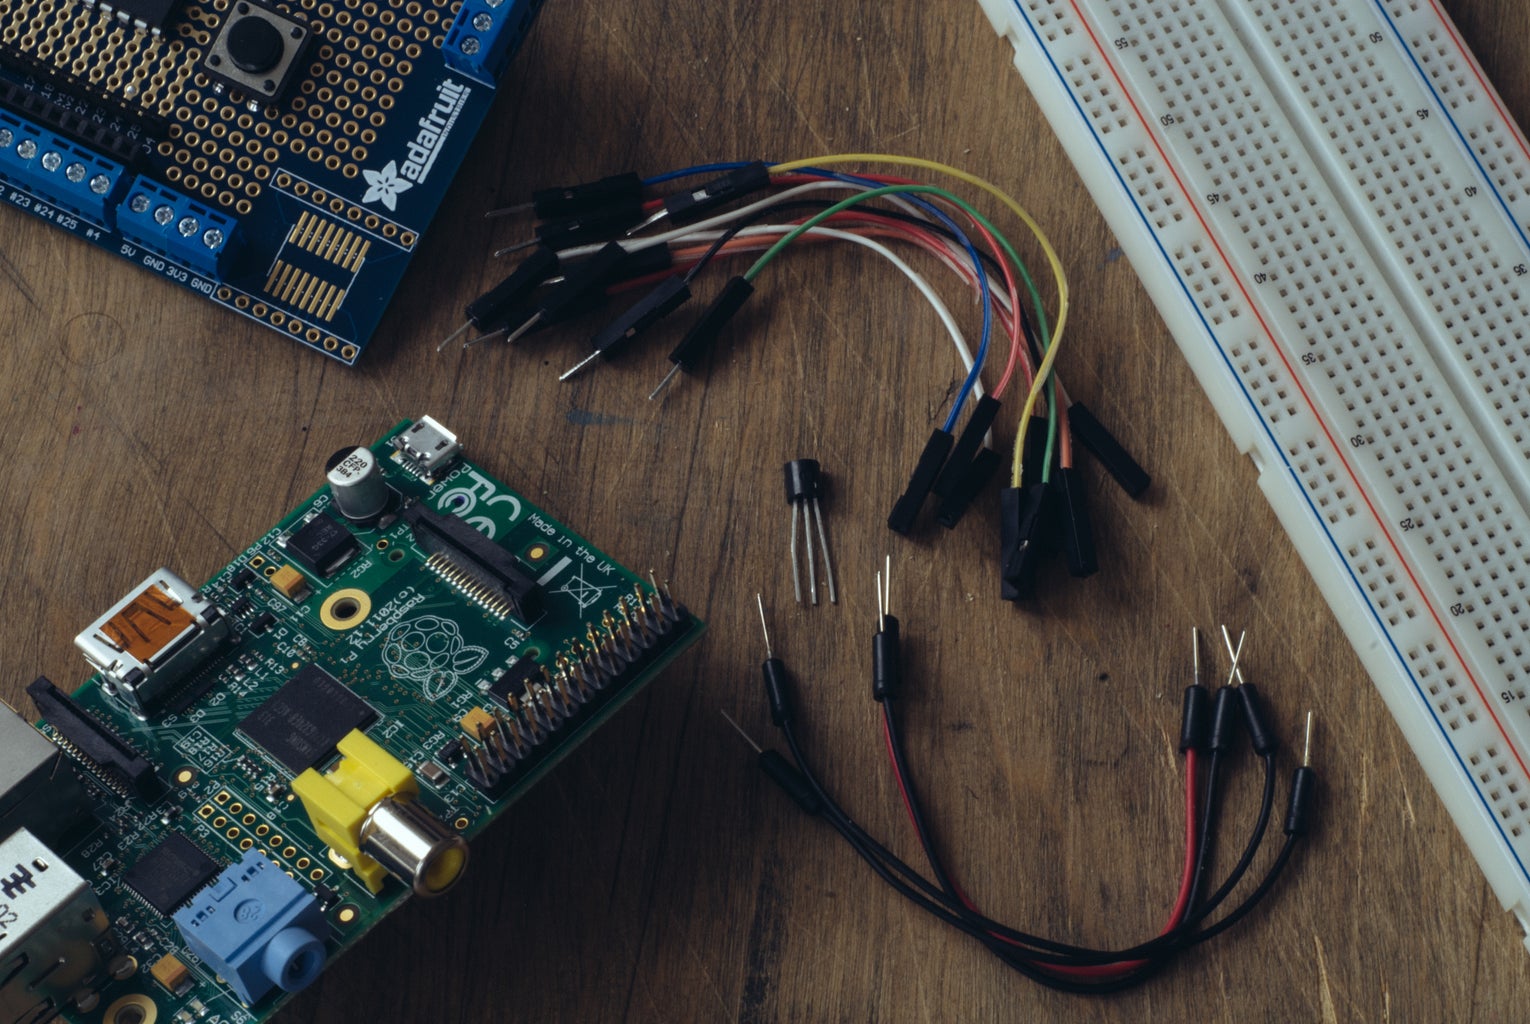
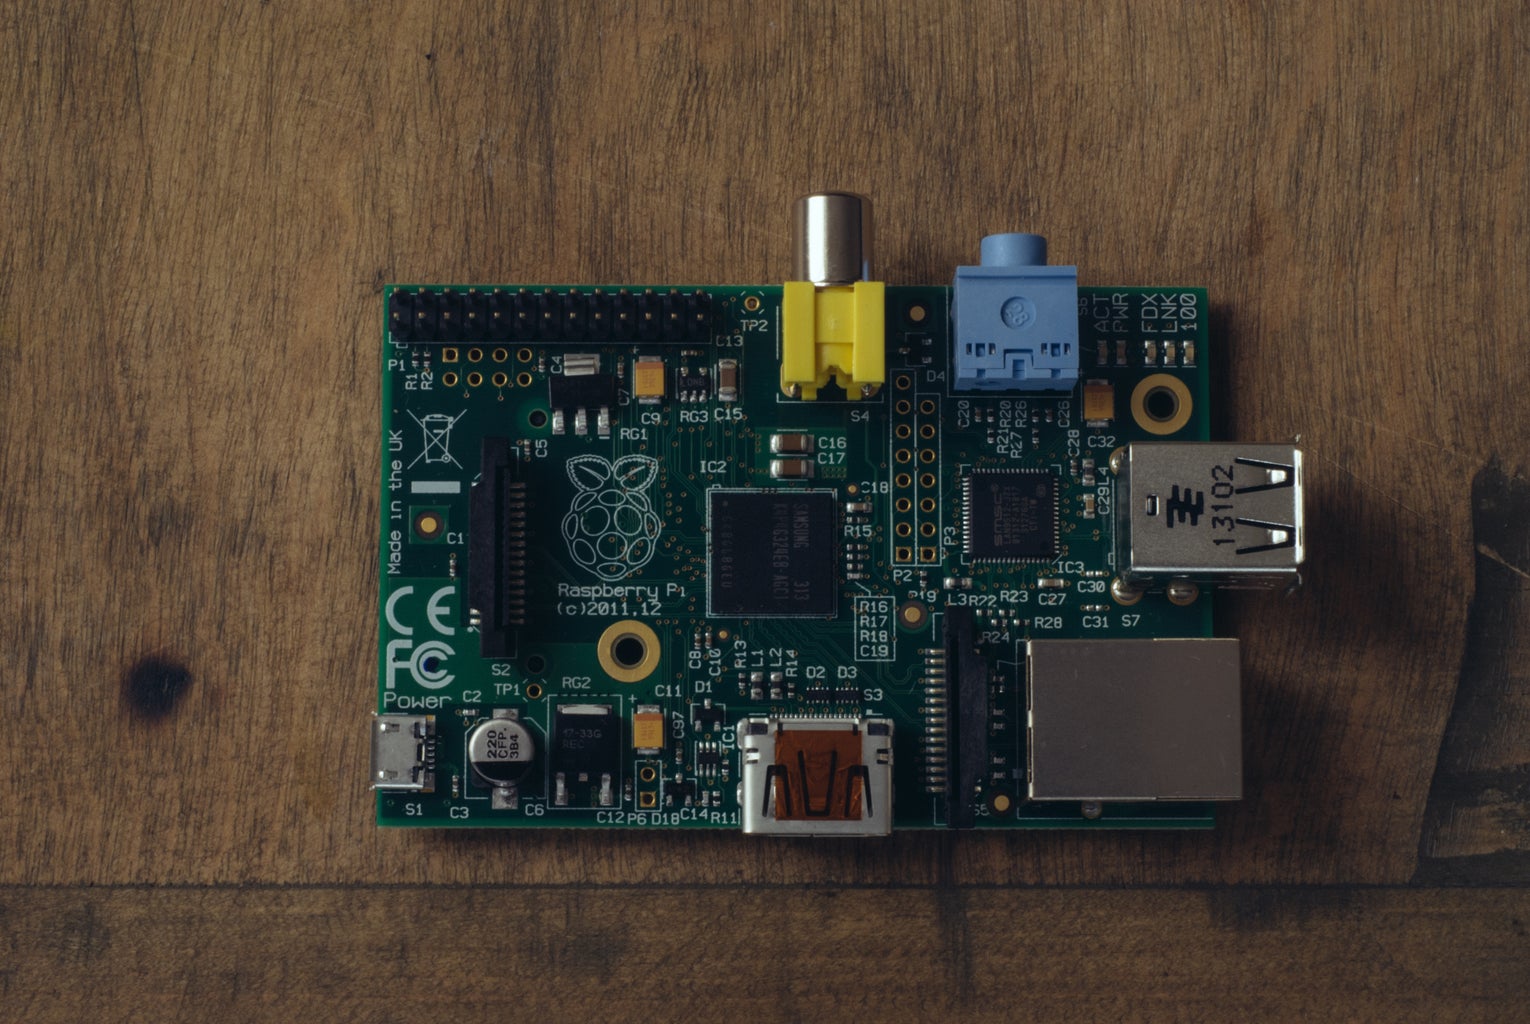


Raspberry Pi
MCP3008 DIP-package ADC converter chip
Analog Temperature Sensor TMP-36
Breadboard
Some Hookup wire
Some Software Packages (Details in later steps)
For the solderless option :
For the more permanent shield option:
You'll need a Plot.ly Account. Head over to:
Step 2: SSH Into Your Pi

Hopefully you've got your Raspberry Pi hooked up to your local network. If you do, SSH right into it and you're ready for the next step!
If not, check out this link, it's a great primer on getting started with SSH on your Pi:
http://learn.adafruit.com/adafruits-raspberry-pi-lesson-6-using-ssh
Once you're logged in, head over to the next stop and run the command listed there.
We used this guide to get SSH working over our Laptop's WIFI. All you need is an ethernet cable. It works well for testing, and when everything is ready you can hook it up to your Router.
http://www.interlockroc.org/2012/12/06/raspberry-pi-macgyver/
Step 3: Software Setup - Run All of These Commands in Your Terminal
sudo apt-get install python-dev
sudo apt-get install python-pip
sudo pip install rpi.gpio
sudo pip install plotly
Step 4: More Software
Download the Plot.ly Raspberry Pi Getting Started Script
- OR
Clone the Repo from Github:
https://github.com/plotly/raspberrypi
Change to the new directory
cd rasperrypi
Step 5: Advanced Users: Plotly Python Library
Should you want to deviate from the Quickstart method, you can of course just use the Plot.ly Python Library like you would on any other system. Take a look inside the included Quickstart Scripts to see whats going on under the hood and get started writing your own personalized scripts!
All of the normal Plot.ly Python library functions work on the Raspberry Pi as well!
Step 6: Hardware Hookup


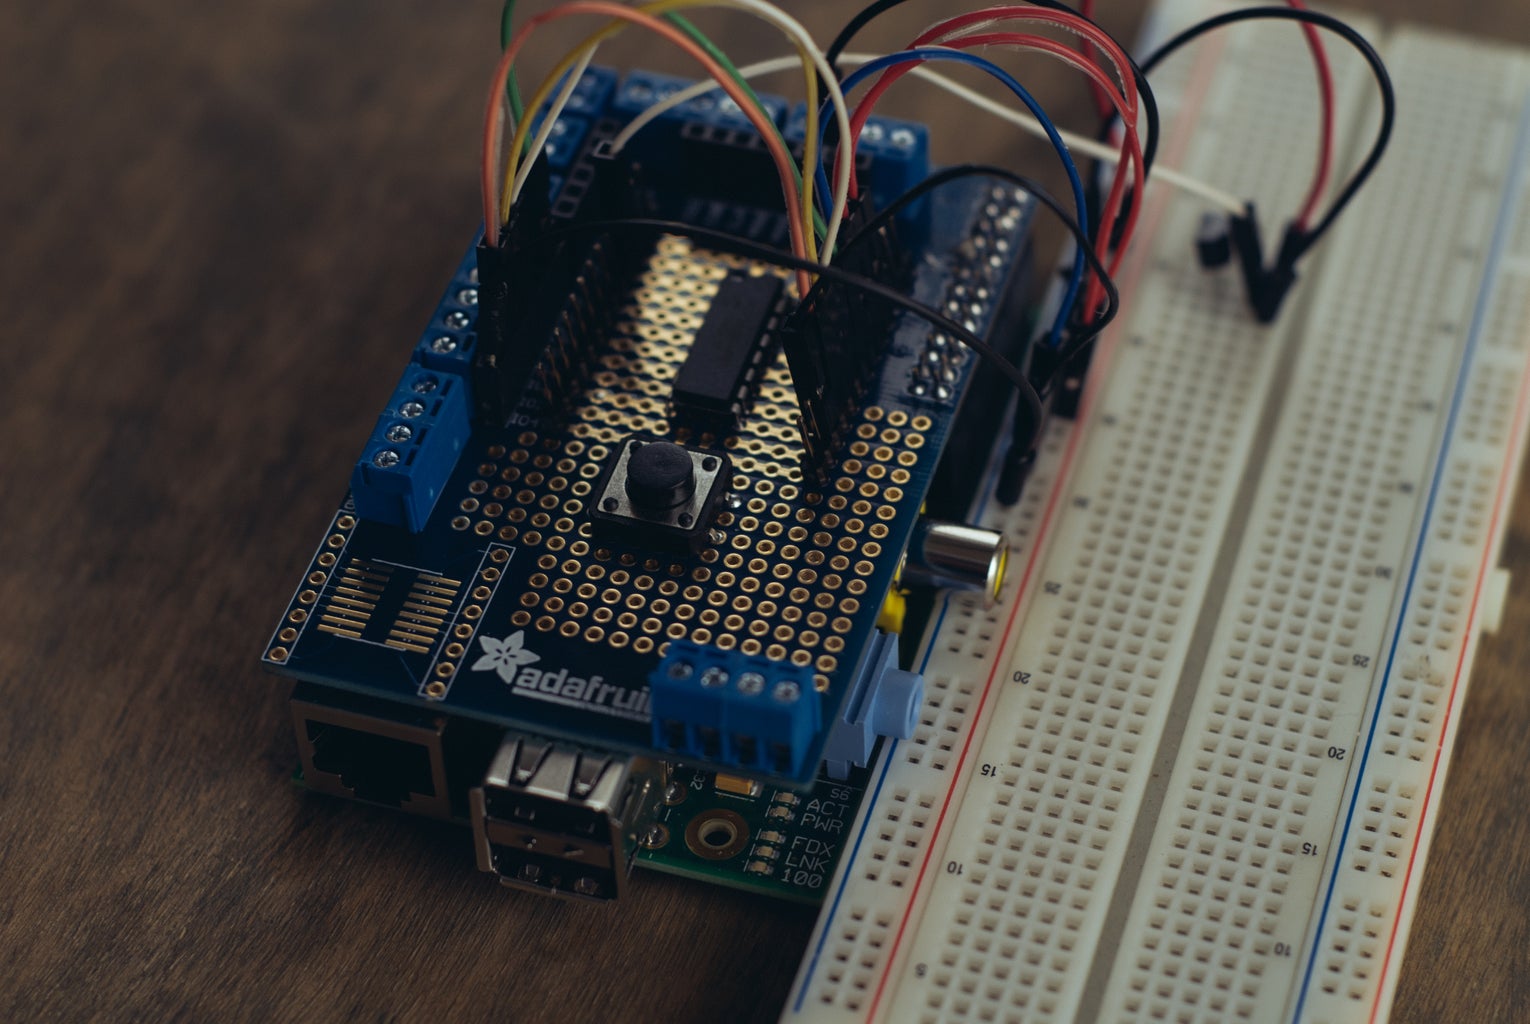
The Raspberry Pi does have GPIO, however without some extra help from a MCP3008 Chip, it cannot read analog inputs.
No problem, just breadboard your MCP3008, and connect your Pi Cobbler, or Solder it directly onto your Prototype Shield. You'll be slingin' some analog data in no time!
Connect the following pins from the Raspberry Pi's GPIO pins the MCP chip:
MCP3008 VDD (PIN16) : 3.3V
MCP3008 VREF (PIN15) : 3.3V
MCP3008 AGND (PIN14) : GND
MCP3008 CLK (PIN13) : #18
MCP3008 DOUT (PIN12) : #23
MCP3008 DIN (PIN11): #24
MCP3008 CS (PIN10): #25
MCP3008 DGND (PIN9) : GND
Connect the following pins from the TMP36 :
(Flat Face Forward, Left to Right)
Pin1 : 3.3V
Pin2 : MCP3008 CH0 (PIN 1)
Pin3 : GND
Step 7: Firing It Up
Now, if you have everything connected properly, and you've downloaded the getting started script, go ahead and execute it! Thanks to Plot.ly's streaming capabilities, all of your sensor data will automatically update on the graph!
Make sure you update the credentials in the script with your own! (Obtained in previous step)
username = 'your_plotly_username'
api_key = 'your_api_key'
stream_token = 'your_stream_token'
Then, run the script! (You have to sudo to access the GPIO pins)
sudo python plotly-raspi-stream.py
In this script, you will enter in your desired graph information, as well as API Key and Stream Token (Obtained earlier).
Now you can cruise right over to the URL provided from the script! Paste it right into your browser if you're using the Raspberry Pi in a Graphical Environment, or fire up your browser on your main computer to see your work!
Once you've opened your graph, feel free to click on "Save and Edit" (don't worry, your graph will be saved regardless) to edit the style and change the titles in the GUI.
Happy Streaming!!
Here is an example graph made with streamed data from a Raspberry Pi: