

Introduction: Benchmarking C++ Arrays on the Pi Pico


There's a wide range of programming languages available for the RP2040-based Pi Pico microcontroller board including C/C++, MicroPython, CircuitPython and some niche options like Rust, Nim and JavaScript. C/C++ are more difficult to wield safely but can be attractive for high performance and full access to the hardware via the Pico SDK. They will be needed for some real-time or computationally intensive applications.
The C++ language has a Standard Template Library (STL) which provides objects to store data called containers. These include std::array and std::vector which are alternatives to traditional C-style arrays. This article looks at how to do some simple benchmarking of these data structures to examine the relative performance of iteration. For a compiled language this inevitably warrants exploration of the compiler's optimisation features as these are likely to impact the execution time.
A general purpose computer is needed to run the C++ compiler to produce code for the Pi Pico. A Raspberry Pi is a common choice for this and was used to cross-compile the ARM M0+ code for the Pi Pico for the benchmarking presented here.
It is easy to attach an affordable hardware debugger to the Pi Pico in the form of a Raspberry Pi, a Raspberry Pi Debug Probe, a second Pi Pico or something like a J-Link EDU Mini. These can be used for profiling which overlaps with benchmarking. This is not explored in this article.
Supplies
- Pi Pico.
- Host computer to compile code - a Raspberry Pi is suitable.
Step 1: Classic Array Iteration in C
A C program typically iterates over an array using a for loop like this:
    int classic_array[8192];
    for (int i=0; i < 8192; i++) {  # "C" style
      classic_array[i] = 123;
    }
This approach depends on the for loop correctly generating the index values for the whole array. C and C++ compilers place performance above safety and have no bounds checking for these arrays meaning it's easy to unintentionally read and write to others parts of memory surrounding the array with a rogue index value. Errors in code like this can lead to memory safety vulnerabilities, buffer overflow being a common one. This particular simple code snippet is relatively easy for static analysers to check for safety and risks.
A compiler produces code based on the programmer's code as written but also includes an optimiser to try and improve the code and tailor it for the target platform. It may spot there's assignment to the array elements but after that they aren't used. That could lead to the code being partially or fully eliminated and even the space never being allocated for the array.
A benchmark seeks to measure the resources needed for some code, typically focussing on the execution time. It's important to avoid optimisations that remove redundant code if the aim is to measure how long that code takes to execute. Using the values in a second array feels like a good way to attempt to stop the optimiser throwing away the code.
    int32_t total = 0;
    int32_t classic_array[8192];
    for (int i=0; i < 8192; i++) {  # "C" style
      classic_array[i] = 123;
    }
    for (int i=0; i < 8192; i++) {
      total += classic_array[i];
    }
For a general benchmark the use of int could be problematic here as it can vary in size across platforms. The minimum size of int was defined by the original K&R C standard and latter ANSI/C99 standards as a minimum 16bit signed type. It was originally intended to match the word size of the processor but modern 64bit platforms maintain a 32bit int size (LP64 & LLP64) for improved code compatibility. A 16bit int can appear to be from the distant past but they are still in use on the ubiquitous ATmega328P-based Arduino Uno Rev3 platform.
The performance of an array of floating point values using float or double would be considerably slower as the RP2040 in common with other M0 & M0+ designs does not have a floating point unit (FPU).
Step 2: Standard Template Library Sequence Containers

The Standard Template Library (STL) provides some alternatives to the traditional C array, the two explored here are:
- std::array - this is a fixed size array, the size is set at compile-time and cannot be changed.
- std::vector - a resizable array, an initial size can be set.
C++ also has some cleaner and safer approaches for iterating over all of the elements of these sequence container data types.
    for (auto it = cpp_array.begin(); it != cpp_array.end(); it++) {  # "iter1" style
      *it = 123;
    }
    for (auto it = cpp_array.begin(); it != cpp_array.end(); it++) {
      total += *it;
    }
C++ 11 introduced std::begin and std::end providing a different way of writing iter1 style (this is just a term used in this article) loops and the newer, more elegant iter2 style of iteration.
    for (auto& elem : cpp_array) {  # "iter2" style
      elem = 123;
    }
    for (const auto& elem : cpp_array) {
      total += elem;
    }
The at method is a way to access an STL sequence container element with bounds checking throwing a std::out_of_range exception.
    for (int32_t i=0; i < ARRAY_LEN; i++) {  # "at" style
      cpp_array.at(i) = THE_NUMBER;
    }
    for (int32_t i=0; i < ARRAY_LEN; i++) {
      total += cpp_array.at(i);
    }
The comment in the code refers to the short name used in the benchmark results to differentiate between the different types of iteration.
The image above is Mikael Persson's flowchart for STL container selection based on David Moore's earlier work. Stack Overflow: std::vector versus std::array in C++ has an informative discussion on the differences between the the two and C arrays.
Step 3: Creating the Pi Pico Project
The Pi Pico SDK uses cmake to configure the project for the board with executables then being built with make. There are two options here to create a new project for the benchmarking code:
- Copy and modify an existing similar project like one from pico-examples.
- Make a new one with the aid of a convenient tool.
For the second option the pico-project-generator allows new projects to be easily created. The command line below was used to create the array_performance Pi Pico project found in GitHub: kevinjwalters cpp-pico-examples.
pi$ ../pico-project-generator/pico_project.py --usb --nouart array_performance
PICO_SDK_PATH is /home/USER/doc/tech/pi-pico-sdk-setup/pico/pico-sdk
Defaulting PICO_PLATFORM to rp2040 since not specified.
Defaulting PICO platform compiler to pico_arm_gcc since not specified.
PICO compiler is pico_arm_gcc
-- The C compiler identification is GNU 8.3.1
-- The CXX compiler identification is GNU 8.3.1
-- The ASM compiler identification is GNU
-- Found assembler: /usr/bin/arm-none-eabi-gcc
-- Detecting C compiler ABI info
-- Detecting C compiler ABI info - done
-- Check for working C compiler: /usr/bin/arm-none-eabi-gcc - skipped
-- Detecting C compile features
-- Detecting C compile features - done
-- Detecting CXX compiler ABI info
-- Detecting CXX compiler ABI info - done
-- Check for working CXX compiler: /usr/bin/arm-none-eabi-g++ - skipped
-- Detecting CXX compile features
-- Detecting CXX compile features - done
Build type is Debug
Using regular optimized debug build (set PICO_DEOPTIMIZED_DEBUG=1 to de-optimize)
PICO target board is pico.
Using board configuration from /home/USER/doc/tech/pi-pico-sdk-setup/pico/pico-sdk/src/boards/include/boards/pico.h
-- Found Python3: /usr/bin/python3.9 (found version "3.9.2") found components: Interpreter
TinyUSB available at /home/USER/doc/tech/pi-pico-sdk-setup/pico/pico-sdk/lib/tinyusb/src/portable/raspberrypi/rp2040; enabling build support for USB.
Compiling TinyUSB with CFG_TUSB_DEBUG=1
BTstack available at /home/USER/doc/tech/pi-pico-sdk-setup/pico/pico-sdk/lib/btstack
cyw43-driver available at /home/USER/doc/tech/pi-pico-sdk-setup/pico/pico-sdk/lib/cyw43-driver
Pico W Bluetooth build support available.
lwIP available at /home/USER/doc/tech/pi-pico-sdk-setup/pico/pico-sdk/lib/lwip
mbedtls available at /home/USER/doc/tech/pi-pico-sdk-setup/pico/pico-sdk/lib/mbedtls
Using PICO_EXAMPLES_PATH from environment ('/home/USER/doc/tech/pi-pico-sdk-setup/pico/pico-examples')
-- Configuring done
-- Generating done
-- Build files have been written to: /home/USER/dev/cpp-pico-examples/array_performance/build
The output of Build type is Debug above shows how the build directory has been configured with a CMAKE_BUILD_TYPE of Debug rather than Release.
Step 4: The C++ Code
The benchmark code is a simple set of for loops which execute the different variations which are written as functions. The code for bm_cpp_array_iter2 is shown below.
IteratingBenchmarkResults bm_cpp_array_iter2(void) {
  int32_t total = 0;
  int64_t dur_inst_us, dur_iter_us;
  size_t data_size;

  absolute_time_t t1 = get_absolute_time();
  {
    absolute_time_t t2, t3;
    t1 = get_absolute_time();
    std::array<int32_t, ARRAY_LEN> cpp_array;
    t2 = get_absolute_time();
    for (auto& elem : cpp_array) {  # "iter2" style
      elem = THE_NUMBER;
    }
    for (const auto& elem : cpp_array) {
      total += elem;
    }
    t3 = get_absolute_time();
    dur_inst_us = absolute_time_diff_us(t1, t2);
    dur_iter_us = absolute_time_diff_us(t2, t3);
  }
  if (debug) printf("size %zu bytes, duration %" PRId64 " + %" PRId64 "us\n", data_size, dur_inst_us, dur_iter_us);
  return { t1, dur_inst_us, dur_iter_us, total };
}
This is creating a std::array object and then iterating over the whole array using modern C++ syntax. The first loop assigns a value to each element, the second loop adds those values up resulting in total equalling THE_NUMBER * ARRAY_LEN assuming there is no overflow. The timing functions, get_absolute_time and absolute_time_diff_us, are specific to the Pi Pico SDK. These appear useful as the use of microseconds as a unit suggest the timing is capable of sub-millisecond resolution.
The calculated total variable is placed in the returned struct variable. This is very intentional and makes it harder for the optimiser to determine if the value is used or not.
Step 5: Compiling C++ for the Pi Pico
It's useful for the manual build process here to create separate build directories to make it clear which one is which. The build directory is created by pico_project.py, two more can be created for -O0 and -O3 optimisation.
pi$ ( cd build.debug && cmake -DCMAKE_BUILD_TYPE=Debug -DPICO_DEOPTIMIZED_DEBUG=1 .. )
pi$ ( cd build.o3 && cmake -DCMAKE_BUILD_TYPE=Release .. )
The flags (command line options) used for the C++ compiler can be inspected from the generated files:
pi$ diff {build,build.o3}/CMakeFiles/array_performance.dir/flags.make | \
> fgrep CXX_FLAGS | fold -s -w 62
< CXX_FLAGS = -mcpu=cortex-m0plus -mthumb -Og -g
-ffunction-sections -fdata-sections -fno-exceptions
-fno-unwind-tables -fno-rtti -fno-use-cxa-atexit -std=gnu++17
> CXX_FLAGS = -mcpu=cortex-m0plus -mthumb -O3 -DNDEBUG
-ffunction-sections -fdata-sections -fno-exceptions
-fno-unwind-tables -fno-rtti -fno-use-cxa-atexit -std=gnu++17
The diff above shows how the optimisation option differs for the two builds in question. The disabling of C++ exceptions is an important factor here as the at method throws or rather attempts to throw these!
Here's a quick summary of all of the build directories and their optimisation levels.
pi$ for bdir in build.debug build build.o3
> do
>  echo ${bdir} $(fgrep CXX_FLAGS ${bdir}/CMakeFiles/*.dir/flags.make | tr ' ' '\012' | grep '^-O')
> done
build.debug -O0
build -Og
build.o3 -O3
The -Og level is a compromise between optimisation and allowing the debugger to be useful - some optimisations can confuse the debugger and the user using the debugger.
The (cross-)compilation is then performed with make.
pi$ ( cd build.debug && make ) ; ( cd build && make ) ; ( cd build.o3 && make )
This will produce uf2 files which can be copied to the Pi Pico in BOOT mode to deploy them.
pi$ cp build.o3/array_performance.uf2 /media/USER/RPI-RP2
Step 6: Running Benchmarks and Collecting Data

Once the code is installed on the Pi Pico the program runs the benchmarks after a 5 second pause on power-up or reset. The data is written to the serial console over USB and this can be collected with a terminal emulation program with a logging/capture feature like minicom. The minicom terminal defaults to 80 columns and the long lines will appear truncated on screen but the capture file will have all of the data.
pi$ minicom -b 115200 -o -D /dev/ttyACM0 -C array_performance-output.csv
For the benchmarking here this was left to repeat three times for each of the three programs (uf2 files) installed with three uniquely-named capture files for the csv output.
pi$ head -14 results/array_performance-v1.1-release-20231109-i.csv
start_ms,benchmark,data_store,iterator_style,duration_us,run,core,cpu_frequency,compiler_flags
5003,"bm_classic_array","C","C",612,0,0,0,"-O3"
5004,"bm_classic_array","C","C",639,1,0,0,"-O3"
5005,"bm_classic_array","C","C",626,2,0,0,"-O3"
5006,"bm_classic_array","C","C",622,3,0,0,"-O3"
5007,"bm_classic_array","C","C",624,4,0,0,"-O3"
5007,"bm_classic_array","C","C",629,5,0,0,"-O3"
5008,"bm_classic_array","C","C",629,6,0,0,"-O3"
5009,"bm_classic_array","C","C",621,7,0,0,"-O3"
5010,"bm_classic_array","C","C",623,8,0,0,"-O3"
5010,"bm_classic_array","C","C",626,9,0,0,"-O3"
6011,"bm_classic_array_unused_result","C","C",1,0,0,0,"-O3"
6011,"bm_classic_array_unused_result","C","C",1,1,0,0,"-O3"
6011,"bm_classic_array_unused_result","C","C",0,2,0,0,"-O3"
The arithmetic mean for the bm_classic_array shown here is 625.1us. For bm_classic_array_unused_result the optimiser appears to have got overly keen and eliminated most of the benchmark code with times of 0us or 1us!
The image above is the disappointing output from DALL-E 3 with the input: the discovery one spacecraft from 2001 in space next to a 200 foot raspberry pi pico and a moon that looks like a stopwatch.
Step 7: Benchmarking by Iteration Style

This chart shows the time each benchmark takes at optimisation -Og. The height of each column is the arithmetic mean of the ten or thirty executions with the minimum and maximum values shown by the black box. For example, the first column for the traditional C array depicts a mean of 1637.7us and a min/max of 1622us/1658us. The std::vectoriter1 is a faster at 1061.7us.
The C array has the same performance as the std::array with the exception of the loops using the at method. This makes sense as the at method has the additional functionality of performing bounds checking and also may resist optimisation as it is a method call. The unused variation is the code which does not return the calculated total value - a reasonable guess here is the optimiser is discarding the second loop.
The std::vector performance is surprising as each variation takes a different amount of time compared to std::array. It seems reasonable to assume the less flexible/featureful std::array would have the same performance or be quicker than std::vector but this is not the case here.
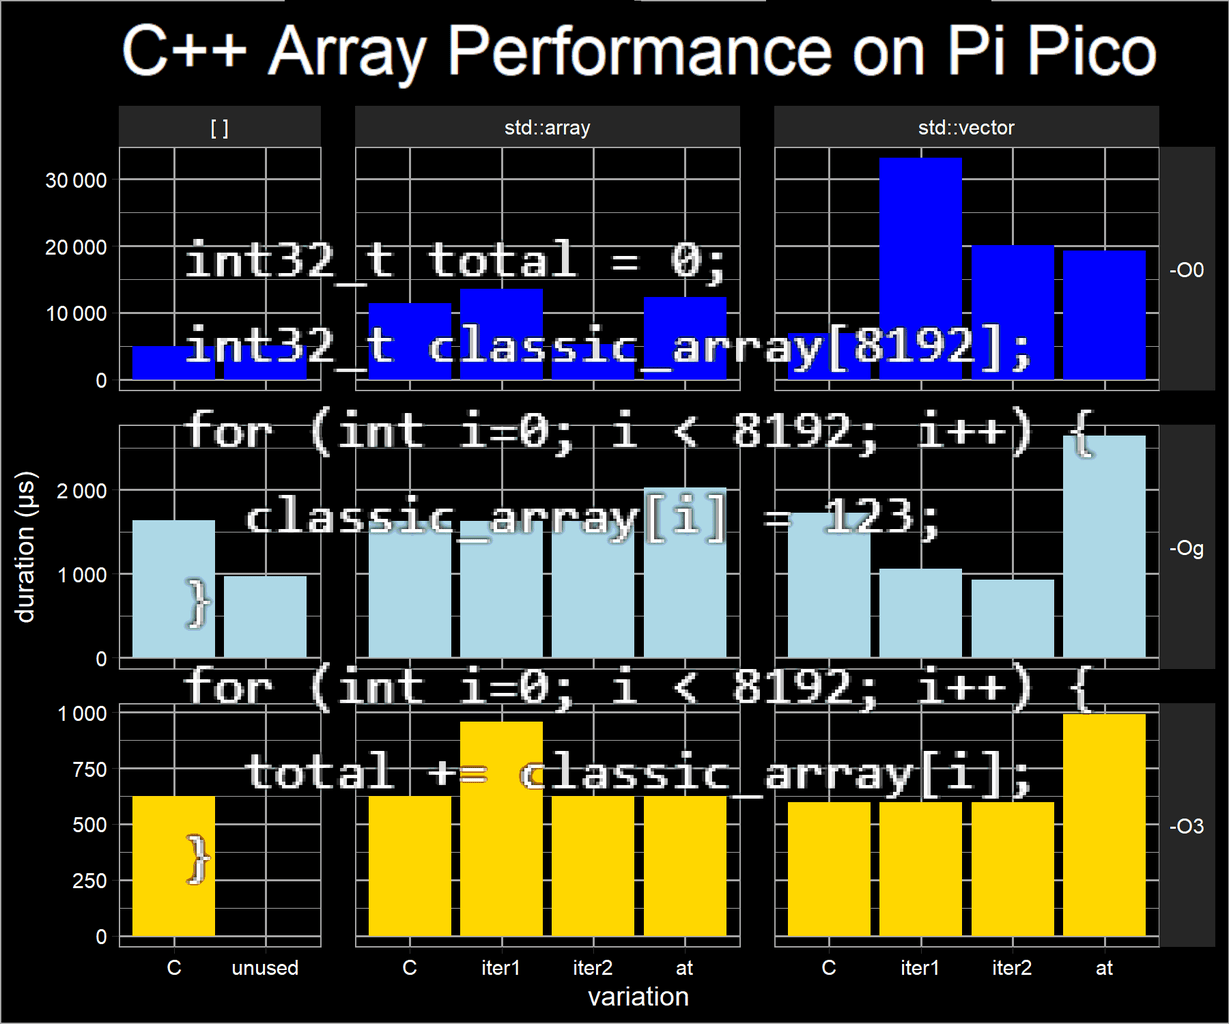
Step 8: Benchmarking by Iteration Style Revisited


The unoptimised code is on the left and the -O3 code is on the right above - the y axis scale differs. The former is surprisingly slow, the arithmetic means for two of the variations are cited below.
- -O0 (Debug):
- C variation is 5019.7us;
- std::vector with iter1 is 33201.4us.
- -O3 (Release):
- C variation is 625.1us (8x speedup);
- std::vector with iter1 is 598.5us (55x speedup).
Step 9: Benchmarking by Optimisation
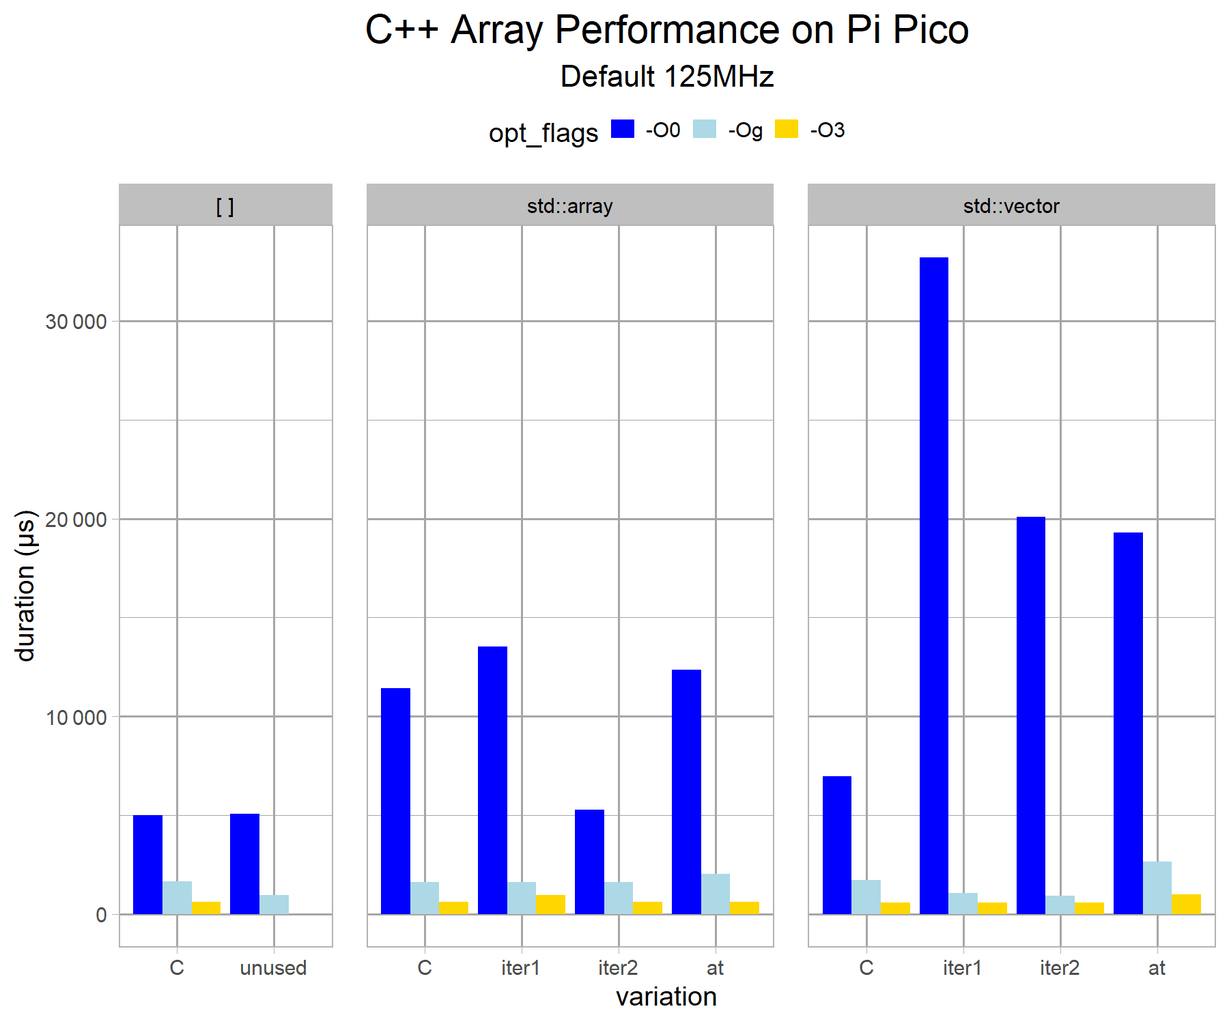

This is just another view of the data on the previous charts. The one on the right has auto-scaled y axes making it easier to observe the relative differences between the benchmark for each optimisation level.
Step 10: Benchmarking CPU Clock Speed

The clock speed of the RP2040 processor can be varied on the Pi Pico using the set_sys_clock_khz SDK function. The default speed for C/C++ programs using the Pi Pico SDK is 125MHz, the datasheet cites a maximum speed of 133MHz. The processor can also be over-clocked.
The benchmark runs the code at the default speed for 10 runs per benchmark and then repeats the benchmarks with the speed set to 25, 125, 133 and 200MHz. The speed is the requested speed, the actual speed may differ a tiny bit due to how the clock is produced.
This chart shows the performance in terms of clock cycles rather than the microseconds used by previous charts. This makes it easier to see any variation in performance taking into account the clock speed. The columns are very similar in height for each benchmark suggesting this code scales perfectly with the processor speed. If memory were a bottleneck then the higher frequency clock speeds would have higher values (more clock cycles) due to introduction of wait states.
Step 11: Testing
There are thin lines between between general testing, application-related benchmarking and load/stress testing.
- A test pass is subject to checking the results are correct but an unexpected deviation in its cpu time is suspicious and a significant increase could be regarded as a failure. This is particularly important if the component contributes to a service where there is a contractual Service Level Agreement (SLA) or an Service Level Objective (SLO) to keep the users happy.
- An application benchmark should also check the results are actually correct! This becomes more important if exotic/atypical optimisations are used or being tested.
The normal expectation for the Pi Pico build system would be the production release of the code is built with -DCMAKE_BUILD_TYPE=Release - this cmake option may be the default but explicitly stating this protects the project/build from any cavalier changes to the build system in the future. It's important to ensure this build is comprehensively tested and not to do the bulk of the testing using the uf2 from the build directory created by pico-project-generator as this is a -DCMAKE_BUILD_TYPE=Debug build.
Step 12: Inspecting the Compiler's Code With Gdb
A C++ compiler can typically be instructed to produce assembler code. This allows the efforts of the optimiser to be observed. The other approach is to disassemble** the machine code in the binary output. This can be achieved using gdb against the elf format binaries - the uf2 files are derived from these.
pi$ echo disassemble bm_classic_array | gdb build.o3/array_performance.elf
For the -O3 binary the loops can be observed between the two calls to the time functions.
  0x10000368 <+20>:  bl   0x10001b60 <time_us_64>
  0x1000036c <+24>:  movs  r5, #128    ; 0x80
  0x1000036e <+26>:  add   r3, sp, #16
  0x10000370 <+28>:  mov   r12, r3
  0x10000372 <+30>:  movs  r6, r0
  0x10000374 <+32>:  movs  r7, r1
  0x10000376 <+34>:  movs  r2, r3
  0x10000378 <+36>:  movs  r0, #123    ; 0x7b
  0x1000037a <+38>:  movs  r1, #123    ; 0x7b
  0x1000037c <+40>:  lsls  r5, r5, #8
  0x1000037e <+42>:  add   r5, r12
  0x10000380 <+44>:  stmia  r2!, {r0, r1}
  0x10000382 <+46>:  cmp   r2, r5
  0x10000384 <+48>:  bne.n  0x10000380 <_Z16bm_classic_arrayv+44>
  0x10000386 <+50>:  movs  r4, #0
  0x10000388 <+52>:  ldmia  r3!, {r2}
  0x1000038a <+54>:  adds  r4, r4, r2
  0x1000038c <+56>:  cmp   r3, r5
  0x1000038e <+58>:  bne.n  0x10000388 <_Z16bm_classic_arrayv+52>
  0x10000390 <+60>:  bl   0x10001b60 <time_us_64>
The inner part of the first loop
    for (int32_t i=0; i < ARRAY_LEN; i++) {
      classic_array[i] = THE_NUMBER;
    }
is compiled to
  0x10000380 <+44>:  stmia  r2!, {r0, r1}
  0x10000382 <+46>:  cmp   r2, r5
  0x10000384 <+48>:  bne.n  0x10000380 <_Z16bm_classic_arrayv+44>
The stmia instruction is an efficient way to write multiple 32bit values to memory, in this case a pair. This works because the compiler can tell the fixed size array has an even number of elements. The loop is complete when the r2 register has the same value as r5, i.e. the final element pair has been reached and written to.
The inner part of the second loop
     for (int32_t i=0; i < ARRAY_LEN; i++) {
      total += classic_array[i];
    }
is compiled to
  0x10000388 <+52>:  ldmia  r3!, {r2}
  0x1000038a <+54>:  adds  r4, r4, r2
  0x1000038c <+56>:  cmp   r3, r5
  0x1000038e <+58>:  bne.n  0x10000388 <_Z16bm_classic_arrayv+52>
This is reading the elements into the r2 register and adding those to r4 with the same end of loop approach as before.
A human can look at these two simple loops and be reasonably certain that the two can be safely combined into one. This optimisation is known as loop fusion but has not occurred here at -O3.
** There is also a build artefact file which has a disassembly of all the code in it, for this example it's called build.o3/array_performance.dis .
Step 13: Going Further

The image above is the disappointing output from DALL-E 3 with the input: a "pi pico w" in space next to a stopwatch and a twinkie.
Some unexplored areas of this benchmarking are:
- Larger arrays.
- The other g++ optimisation levels.
- Non-sequential array access.
- At -O3 the mystery of the slowness of iter1 for std::vector and the mystery of std::vector being slightly faster than std::array.
- Core 1 vs core 0 performance on the RP2040. Benchmark on both cores simultaneously.
- The behaviour of the at method when the index is out of bounds and an exception is thrown with exceptions disabled.
Related projects:
- Some simple math benchmarks for CircuitPython/MicroPython - results can be seen in Adafruit Forums: Benchmarks for CircuitPython?
- CircuitPython 5 displayio text label benchmark - CircuitPython Label test with three versions (YouTube).
- HackSpace magazine
- CircuitPython on ESP32-S2 in Edition 34 (page 67) - this was using CircuitPython 5 and the numbers for the two M4 processors, nRF52840 and SAMD51, look out of proportion.
- Ultimate Overclocking on Raspberry Pi 3
- ulab.fft.fft benchmarking
- EEMBC CoreMark and Paul Stoffregen's CoreMark
- Adafruit Learn: Embedded Linux Board Comparison - for old boards, no longer updated.
- Madhavan Thothadri. An Analysis on Clock Speeds in Raspberry Pi Pico and Arduino Uno Microcontrollers - unexplained strange variations in execution time with clock frequency for Mandelbrot generation on a Pi Pico and RP2040 seems strangely slow compared to ATMega328P.
- Eloquent Arduino Blog: TinyML Benchmark: Fully Connected Neural Networks (now with Raspberry Pi Pico!)
- Profiling Raspberry Pi Pico Projects with VisualGDB - this is a (SWD) hardware debugger based approach.
Further reading:
- Stack Overflow: On a Cortex M0 how expensive is a floating point compare vs an integer compare?
- MicroPython Documentation: Maximising MicroPython speed
- Adafruit Learn: Memory-saving tips for CircuitPython
- Rasperry Pi corner (not Pi Pico)
- Gareth Halfacree
- medium.com Benchmarking the Raspberry Pi 4
- MagPi magazine: Thermal Testing Raspberry Pi 4 (edition 88, page 66)
- SeeedStudio: Raspberry Pi 5 vs. Pi 4 AI performance CPU Benchmark: How much leap forward? - a look at ML inference on one and four CPUs (not GPU)
- Some popular general benchmarks
- Dhrystone and Whetstone
- SPEC (Standard Performance Evaluation Corporation) benchmarks, e.g. SPECint
- 3DMark
- BogoMips


