

Introduction: Electricity Carbon Intensity Display Using Pi Pico W and SSD1306


This article shows how to use the new Raspberry Pi Pico W to download Carbon Intensity data using MicroPython over Wi-Fi and display it on a small OLED screen.
The Carbon IntensityAPI gives access to real-time data on carbon intensity and the generator mix producing electricity for the UK. It also provides a 96 hour forecast based on a machine learning (ML) model. This, coupled with reference data, produces current and future values for the carbon dioxide emitted per kilowatt-hour allowing consumers and smart devices to schedule electricity use to minimise carbon dioxide emissions.
The Pi Pico W is a new version of the Pi Pico board with the addition of a Cypress/Infineon CYW43439 chip making it more suitable for Internet of Things (IoT) applications. MicroPython currently supports the (2.4GHz) Wi-Fi functionality but not Bluetooth. CircuitPython doesn't support either, but Wi-Fi is planned.
The Cytron Maker Pi Pico Base is a board designed for beginners using the Pi Pico or Pi Pico W. The Maker Pi Pico Base is a variant of the Maker Pi Pico replacing the permanently-attached Pi Pico with female headers allowing any Pico with pins to be inserted. These boards have headers and blue LEDs for all of the GPIO, a small speaker, 3.5mm stereo output, a micro SD card slot, a reset button, three buttons, one RGB LED, a socket for an ESP-01 and six 3.3V Seeed Studio Grove connectors. Advanced users may find the board's headers and Grove connectors useful for rapid prototyping and experimentation.
The hardware implementation shown in this article uses approximately 150mW. The data only changes every 30 minutes making this a very suitable project for an electronic paper (e-ink) display. A permanent implementation would be more efficient on devices like an Adafruit MagTag or the new Pimoroni Inky Frame. These would make battery power a more practical prospect.
The carbon intensity data is also available on some tablet/smartphone apps and is likely to be eventually incorporated into domestic in-home displays for energy smart meters.
This project requires some simple, header soldering unless you purchase an SSD1306 screen and Pi Pico W with pre-soldered headers.
Supplies
- Pi Pico W or Pi Pico WH - Kitronik | Digi-Key - it's critical to get the W version as this has Wi-Fi, WH has pre-soldered headers. A free Pico W is included with MagPi Magazine subscriptions.
- 2 x 20pin headers if using the Pi Pico W + solder.
- Cytron Maker Pi Pico Base - Kitronik | Digi-Key - the Pico-less Base version is required.
- Small screen - 0.96in monochrome or yellow/blue SSD1306 OLED. The one shown has an i2c interface but an spi interface would also work with a tiny change to the code. These often come without headers.
- Seeed Studio 4 pin Female Jumper to Grove 4 pin Conversion Cable - four jumper wires could also be used.
Step 1: Step 1: Connecting SSD1306 Screen

The i2c-based screen (SSD1306) connects to the Maker Pi Pico Base's GROVE 1 connector:
- SCL - GP0 (white),
- SDA - GP1 (yellow),
- VCC - 3V3 (red),
- GND - GND (black).
The order of pins on the screen is not standard and may vary from the one in photographs. These screens appear to have onboard 10k pull-up resistors for the i2c bus lines which is likely to be sufficient. The GP0 and GP1 blue LEDs should both illuminate if the i2c bus is healthy - an idle i2c bus has both lines high. Data transfers will show up as small fluctuations in brightness.
Step 2: Installing MicroPython and Carbon Intensity Fuel Mix Program


If you are not familiar with MicroPython then it's worth taking a look at the (free to download) book: Get Started with MicroPython on Raspberry Pi Pico.
- Install the Thonny editor.
- Install the latest version of MicroPython with urequests for Pi Pico W. The Maker Pi Pico Base makes this a little easier as the board can be put in boot mode without yanking the USB power. Holding down the BOOTSEL button on the Pico and tapping the RUN button on the Maker Pi Pico Base will restart the board and make the RPI-RP2 drive appear.
- Setup Thonny for the Pi Pico W.
- Under Tools > Options... menu there is an interpreter tab where MicroPython (Raspberry Pi Pico) needs to be selected. Thonny doesn't distinguish between Pi Pico and Pi Pico W.
- Ensure Thonny can connect to the MicroPython interpreter on the Pi Pico W. Clicking on the STOP icon should show the interpreter's REPL mode in the Shell at the bottom.
- Download the files from GitHub:
- Click on the Raw button on ssd1306.py and use Save as in the browser to download the file to your computer.
- Click on the Raw button on carbon-intensity.py and use Save as in the browser to download the file to your computer.
- Create the secrets.py file (see example below) and fill in the values for your Wi-Fi.
- Load the three python files into Thonny and use Save as to save each one to the Raspberry Pi Pico - the carbon-intensity.py file can be renamed to main.py as part of the Save as operation to make it run when the Pico is turned on. The screenshots above show this selection box and the three files after they have been saved to the Pi Pico.
- On the tab now titled main.py, press the green start icon in Thonny to start the program.
# This file is where you keep secret settings, passwords, and tokens!
# If you put them in the code you risk committing that info or sharing it

secrets = {
  "ssid"         : "INSERT-WIFI-NAME-HERE",
  "password"     : "INSERT-WIFI-PASSWORD-HERE",
}
The Raspberry Pi Foundation's Connecting to the Internet with Raspberry Pi Pico W - Getting Raspberry Pi Pico W online with C/C++ or MicroPython may also be useful.
The MicroPython interpreter runs the main.py file at start-up. CircuitPython can confuse here as it also looks for code.py.
The versions used for this project were:
- MicroPython v1.19.1 for Pi Pico W (with urequests and upip).
Step 3: The Displayed Fuel Mix Data


The SSD1306 screens are typically 128x64 pixels. MicroPython has an 8x8 font which allows 16x8 characters to be displayed.
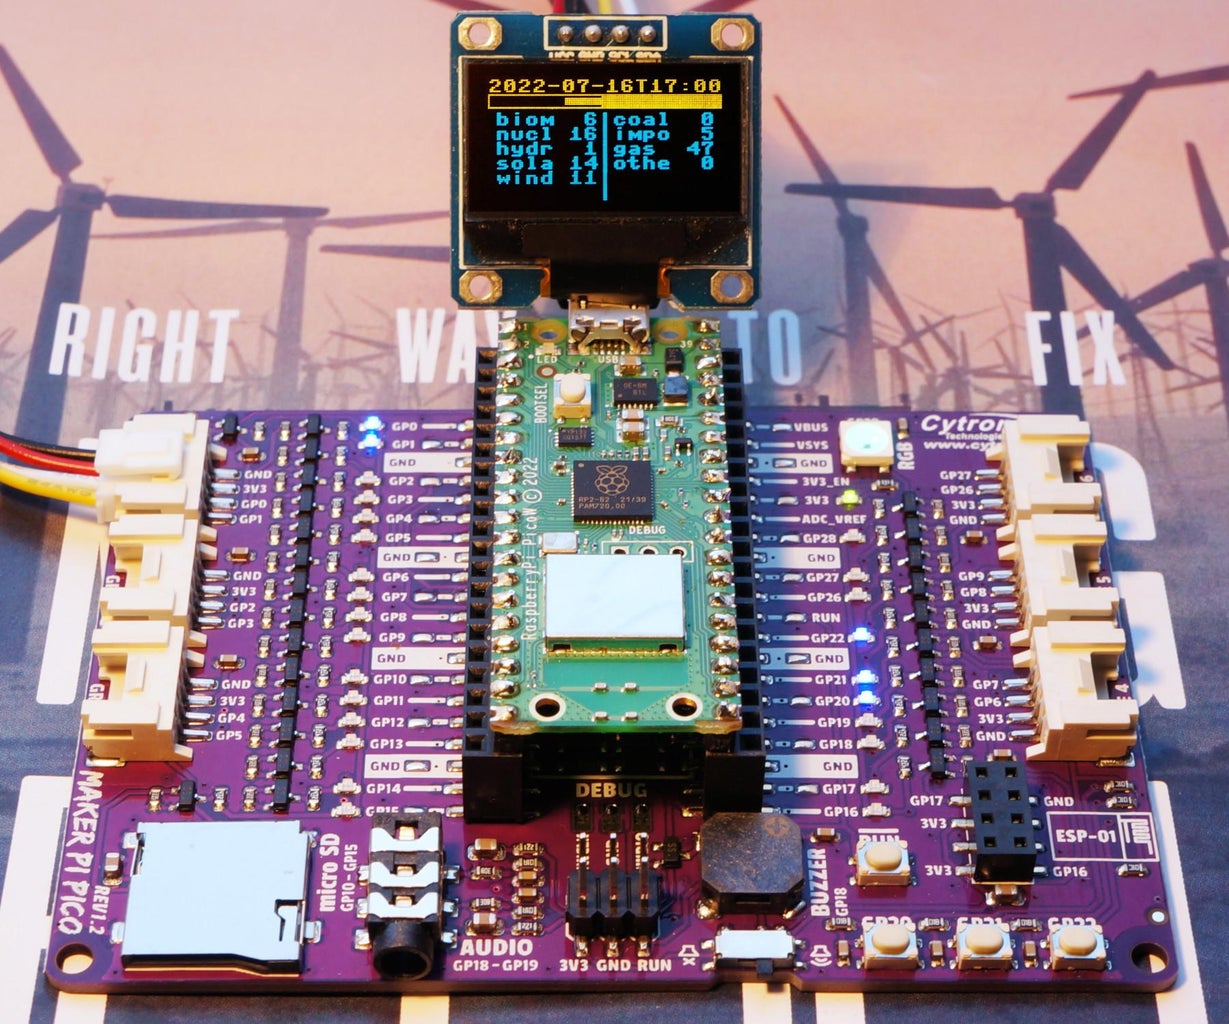
The v1.0 version of the program in the photographs is displaying (from the top):
- The end time for the period the data covers in GMT/UTC/Zulu time. It would be useful to reformat this and localise it.
- A horizontal stacked chart summarising the fuel mixes for the generators. The blank section of the left represents green fuel sources with a carbon intensity below 150 gCO2/kWh. Nuclear fission is shown next with a thin filled bar. The solid bar on the right is for brown sources above 150. The reference values are currently stored in the code. The value per generator may vary for many reasons with imports/exports further complicating things!
- The two column table is the individual fuel type (truncated to four characters) and the percentage. The column split is based on the same carbon intensity threshold. The photo above shows the values at 6pm BST (17:00 GMT) on a sunny day in summer - solar is 14%. The photo at the start of the article shows 9pm values where, as expected, solar has dropped to 1%.
In v1.1 (shown on first page of article) the current (actual) carbon intensity value together with forecasted value are shown at the bottom of the display.
Step 4: Going Further


When you've got your carbon intensity display running, here's some areas to explore:
- Find a similar data source for your country/region and adapt the code to it. Sense power monitors access data for some parts of the US.
- Add a second page with the current and forecast values for the gCO2/kWh.
- Add a page for local data. The (UK) Carbon Intensity API offers fine-grain geographical data.
- Enhance the data display with some graphs. There are some useful examples of framebuf graphics in Instructables: SSD1306 with Raspberry Pi Pico.
- Improve the display of update time. This could show the local time with the aid of an Internet service to find the offset from GMT. The Adafruit libraries often do this based on the timezone set in the secrets.py file.
- If you have a Pi Pico and ESP-01 then these could be used with a Pi Pico Base as an alternative hardware platform. See Instructables: Publishing Particulate Matter Sensor Data to Adafruit IO With Maker Pi Pico and ESP-01S for a CircuitPython example of using services over the Internet with a Maker Pi Pico.
- Investigate low-power processors, boards and screens. Electronic paper (e-ink) displays are an obvious choice here. Adafruit Learn: Deep Sleep with CircuitPython covers this area.
Related Projects:
- Pi Pico W projects
- HackSpace: Raspberry Pi Pico W - adds remote control via a web server to the Kitronik Autonomous Robot platform for Pico.
- Pete Codes Blog: Creating a Basic Raspberry Pi Pico W Web Server using MicroPython - simple project, each step is very well documented.
- Raspberry Pi Foundation: Getting started with your Raspberry Pi Pico W
- Core Electronics: WiFi Garage Door Controller with Raspberry Pi Pico W
- Raspberry Pi Pod and micro:bit base: Use Adafruit IO with a Raspberry Pi Pico W to create IoT dashboards using MQTT
- Carbon Intensity UK applications:
- GridCarbon smartphone/tablet app.
- National Grid WhenToPlugIn app
- https://carbon-gizmo.wwf.org.uk/ - WWF Carbon Intensity Widget which might be beta.
Further Reading:
- Hackster.io: Low-Cost Connectivity for the IoT: Hands-On with the Raspberry Pi Pico W - nice summary of the new board.
- UK specific links
- National Grid ESO Data Portal.
- Gridwatch - a nice dashboard for UK electricity including international DC interlinks.
- Citizens Advice: The value of time of use tariffs.
- National Grid Green Light Signal - using the LIFX mini colour smart bulb to indicate low carbon intensity periods.
- Google X Tapestry Project - "Weaving together the technologies, information, and partners needed for clean, reliable, and affordable electricity" - optimisation of Distributed Energy Resources (DERs).
- NPR: California just ran on 100% renewable energy, but fossil fuels aren't fading away yet - refers to part of the afternoon on 8th May 2022.
- BBC News: Climate change: Four things you can do about your carbon footprint
- The Economist: Have economists led the world's environmental policies astray? Book review of Supercharge Me: Net Zero Faster.
- The Economist: Technology Quarterly: Climate technology
- Nature: IPCC’s starkest message yet: extreme steps needed to avert climate disaster
- World Economic Forum: The Global Risks Report 2022 - top risk by severity is Climate action failure.


![Tim's Mechanical Spider Leg [LU9685-20CU]](https://content.instructables.com/FFB/5R4I/LVKZ6G6R/FFB5R4ILVKZ6G6R.png?auto=webp&crop=1.2%3A1&frame=1&width=306)


